KWEB 7-day bearish forecast — Oct 31, 2026
- Bias: Bearish
- Timeframe: 7 days (made Oct 31, 2026, target date Nov 6, 2026)
- Price at analysis: $22.75
- Price target: $22.50
- Expected range: $22.20 – $23.20
- Result: Incorrect (+9.4%) — closed at $24.88 on Nov 6, 2026; quality score 0/100
Get a free AI analysis of KWEB today
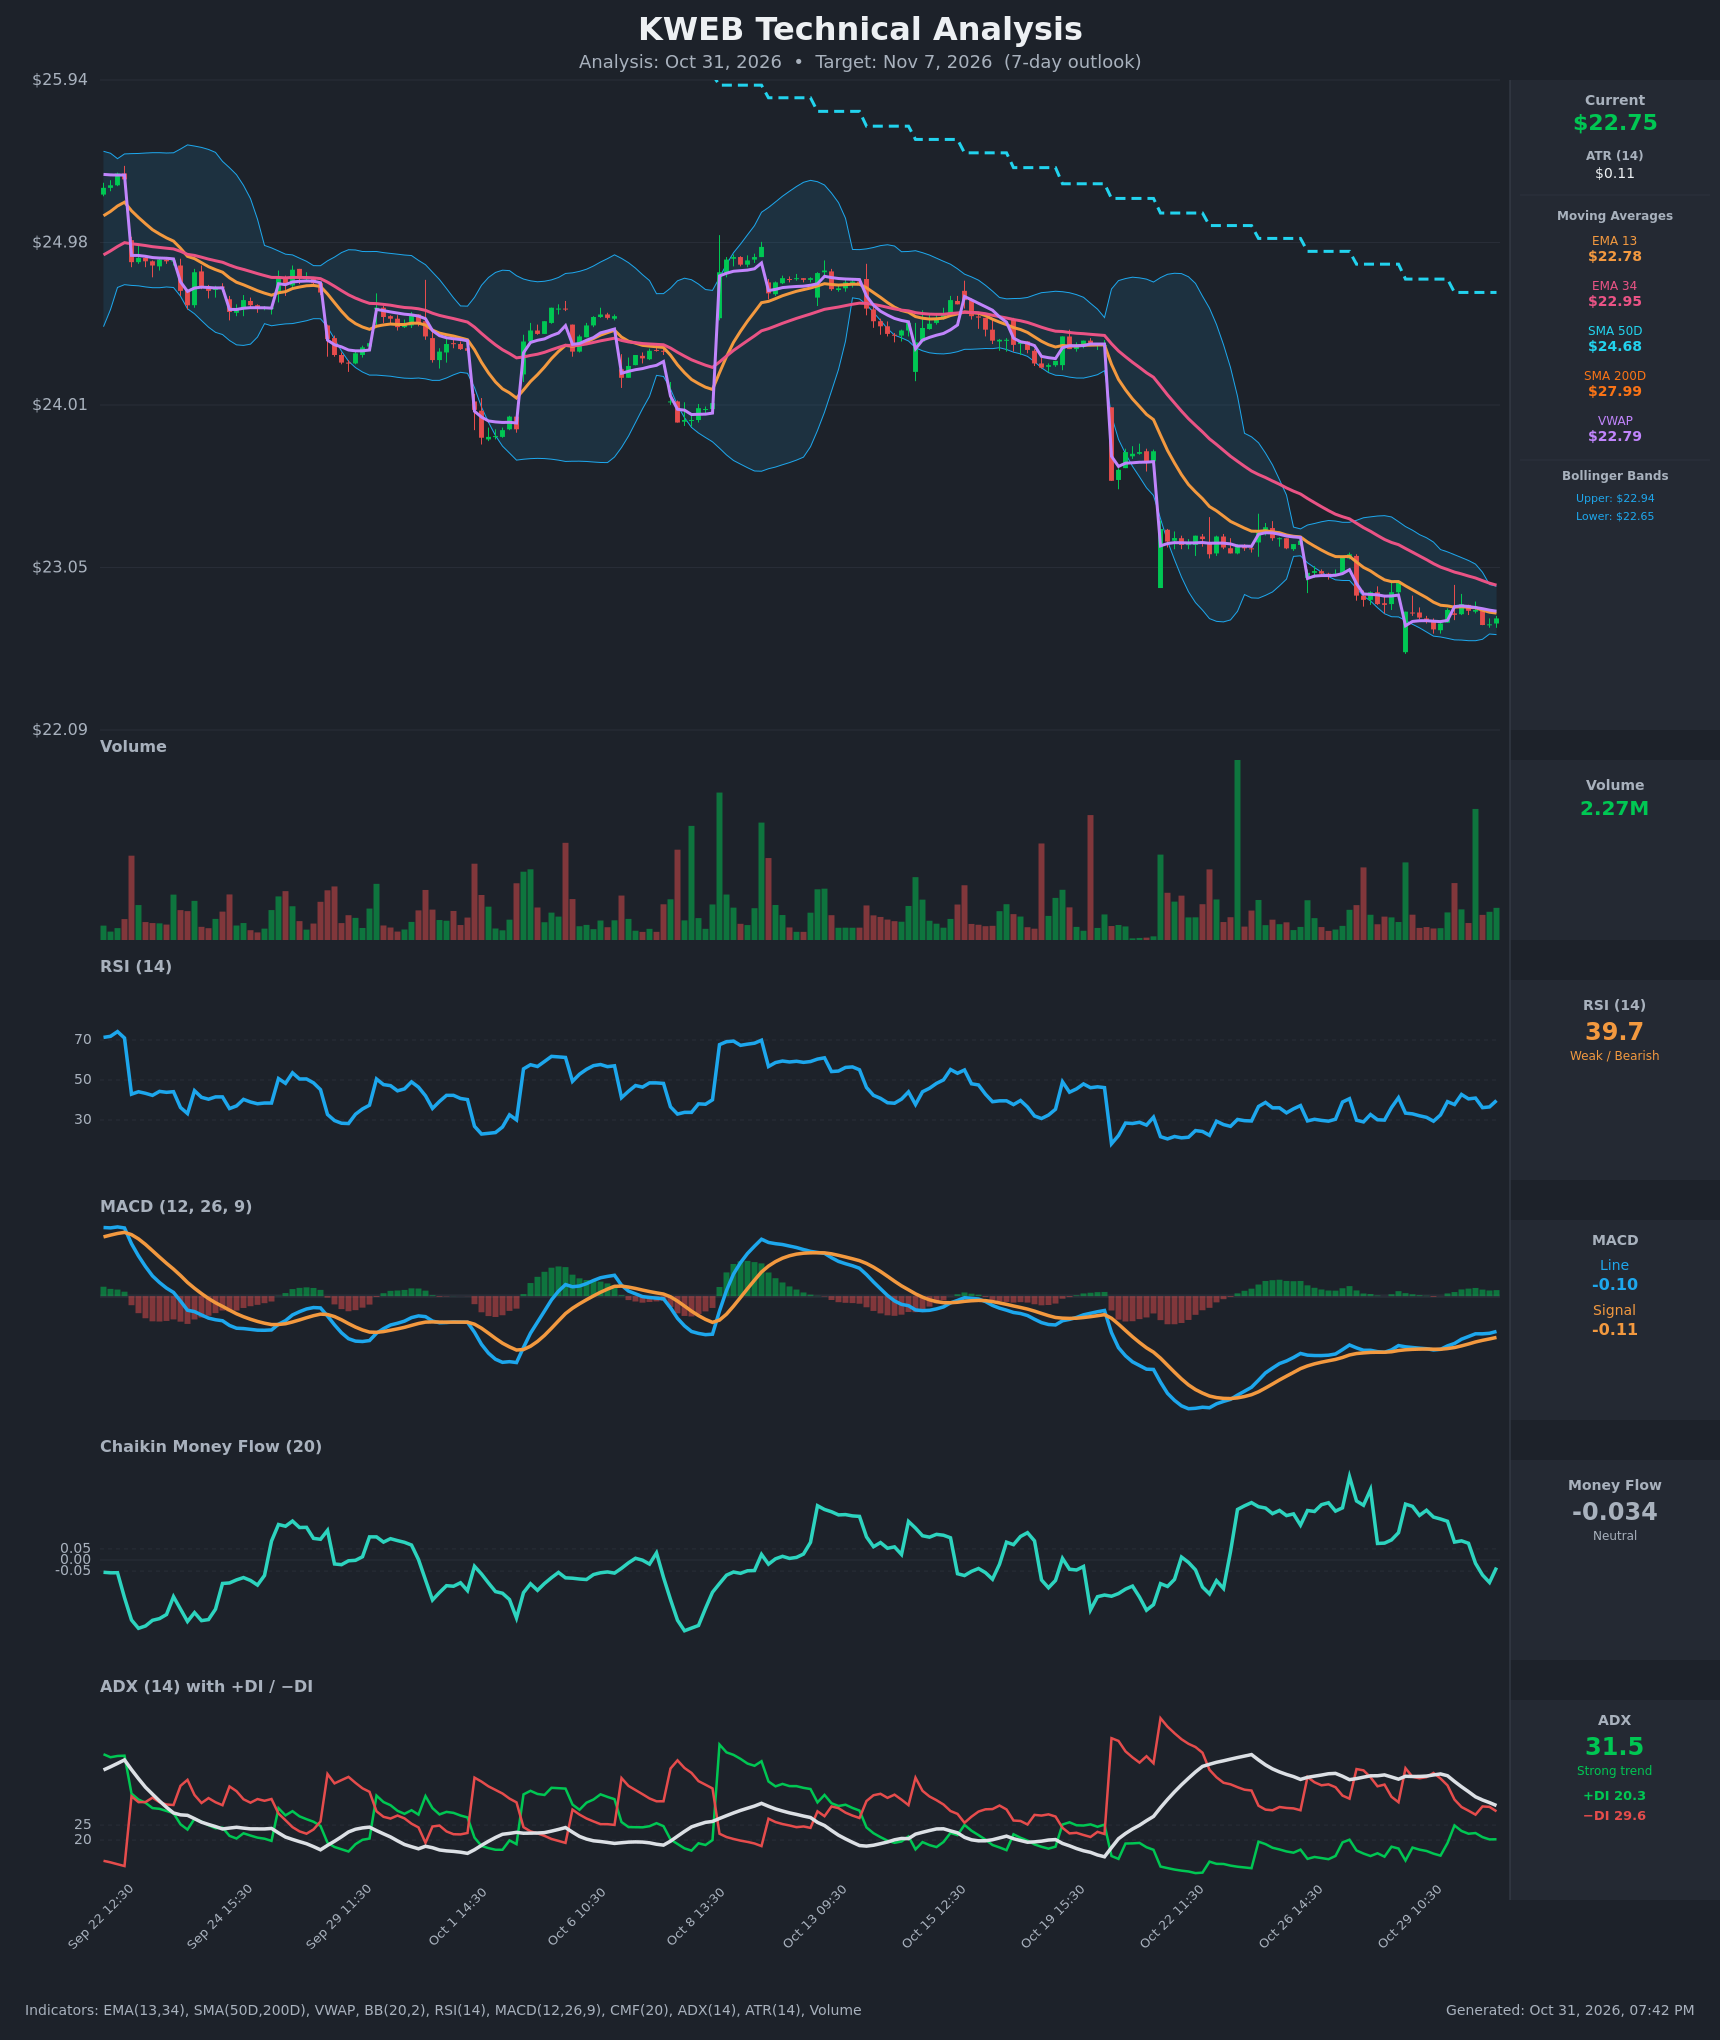
Analysis
TECHNICAL INDICATORS
- RSI (14): 39.73, below the neutral 50 line and bouncing off the oversold zone (it touched 29.4 on Oct 29). It has stayed in a 30-43 band for about 8 sessions, so momentum is weak but selling pressure has eased. [Bearish]
- 20 EMA: Using the EMA 13 ($22.78) and EMA 34 ($22.95) as the short-term trend gauges. Price at $22.75 sits just below both, and the EMA13 is below the EMA34 (a bearish alignment that has persisted all session). The EMAs are sloping down and act as overhead resistance. [Bearish]
- MACD: Line -0.0975 is above the signal at -0.114, a small bullish crossover that happened around Oct 29 (a positive histogram of about +0.017). Both lines are still negative and below zero, so this is a relief bounce within a downtrend rather than a trend reversal. [Neutral]
- Bollinger Bands (20): Upper $22.94, lower $22.65, and the bands are narrow (width of about $0.29, or 1.3% of price). Price is in the lower half, below the midline (about $22.80), and has been riding the lower band. The squeeze after a sharp drop points to a volatility expansion coming. [Bearish]
- CMF (20): -0.034, in the neutral zone between -0.05 and +0.05. It has dropped from +0.25 on Oct 29 to slightly negative, showing money flow deteriorating. [Neutral]
- ADX (14): 31.5 with −DI (29.6) above +DI (20.3), so bears are in control. ADX is above 25 but falling from 42, which means the downtrend is maturing and losing strength. [Strong Trend – Bearish, fading]
- Volume: 2.27M, close to average, with no capitulation spike on the recent downside. The most recent bars show modestly higher volume on up-ticks, suggesting some dip buying, but nothing decisive. [Neutral]
Other trend context: price is below the SMA50 ($24.68) and SMA200 ($27.99), and the SMA50 is below the SMA200, so a death cross is already in place. VWAP is $22.79, and price sits slightly below it.
DIVERGENCES & TRENDS
- Momentum divergence: Price has made lower lows (the $22.5x area on Oct 27-28) while MACD has turned up from its trough near -0.20 and the histogram is positive. This is a mild bullish momentum divergence. The RSI has made higher lows (29 → 36 → 39), a similar mild divergence.
- MACD crossed above its signal around Oct 29-30, but both lines remain below zero.
- ADX is declining from 42 to 31.5 while −DI stays above +DI. The sell-off is losing momentum and is shifting from a trend to a base or consolidation.
- CMF has rolled over from +0.25 to -0.03, which does not confirm the bounce.
- Price is compressed between the EMA13 and the lower Bollinger Band. The EMA13 ($22.78) and VWAP ($22.79) form a tight resistance cluster just above price.
- The SMA50 and SMA200 sit far above ($24.68 and $27.99), so the longer-term trend is firmly down.
CHART PATTERNS
- Bearish Pennant / Bearish Flag (continuation): After the sharp drop from about $24.0 to $23.1 on Oct 21-22, and the further step down to $22.7, price has formed a tight, sideways-to-slightly-lower consolidation. This fits a bearish pennant or flag. A breakdown below $22.65 would project the flagpole (about $0.8-1.0) down, suggesting a measured move toward $22.0-22.2, though that is further than 7 days will likely deliver.
- Descending channel: The series of lower highs and lower lows since mid-October is intact, as in the descending triangle/channel structures on the diagram.
- Bullish Falling Wedge (possible reversal): The narrowing, downward-sloping range with improving momentum could develop into a falling wedge, but there is no breakout yet. Price would need to clear $22.95 (the EMA34) to confirm it.
POTENTIAL SCENARIOS
- Scenario 1: Bearish Pennant Breakdown — Price fails at the EMA13/VWAP cluster (~$22.80) and breaks below the lower Bollinger Band as the squeeze resolves downward, with −DI still dominant. Trigger: close below $22.65 on rising volume. Target: $22.30-$22.40, with an extension to $22.10. Invalidation: close above $22.95 (EMA34). (50% probability)
- Scenario 2: Neutral Range Consolidation — Price chops between $22.55 and $22.95 as ADX continues to fade and the MACD/RSI divergences hold. Trigger: no break of either band edge. Target: $22.60-$22.85. Invalidation: close outside $22.50-$23.00. (25% probability)
- Scenario 3: Bullish Relief Bounce — The momentum divergences play out and price reclaims the EMA13/VWAP and EMA34, squeezing shorts toward the upper band and the gap area. Trigger: close above $22.95 with a rising MACD histogram. Target: $23.20-$23.40. Invalidation: loss of $22.55. (25% probability)
PRICE TARGETS
Range width check: 7-day guidance is about 4-8% of price. Using $22.75, the range is $22.20 to $23.20, a $1.00 width, or 4.4%. This is within the guideline and, as it should be, wider than a 2-3 day range (2-4%).
- Target Price: $22.50 (7 days out)
- Expected Range: $22.20 to $23.20
- Key Levels: Support at $22.55 (recent low and lower Bollinger Band area), Resistance at $22.95 (EMA34 and upper Bollinger Band)
OVERALL BIAS
OVERALL BIAS: BEARISH - Price is below all key moving averages with a death cross in place, −DI is above +DI with ADX at 31.5, and a bearish pennant structure is sitting on the lower Bollinger Band with a volatility squeeze that favors a downside resolution. The MACD crossover and RSI divergence are mild offsets, and the fading ADX tempers conviction, but the weight of evidence still points lower.
This is educational analysis and not financial advice.