IWM 6-day bearish forecast — Nov 1, 2026
- Bias: Bearish
- Timeframe: 6 days (made Nov 1, 2026, target date Nov 6, 2026)
- Price at analysis: $279.39
- Price target: $277.40
- Expected range: $270.80 – $284.20
- Result: Correct (-2.0%) — closed at $273.69 on Nov 6, 2026; quality score 100/100
Get a free AI analysis of IWM today
Analysis
TECHNICAL INDICATORS
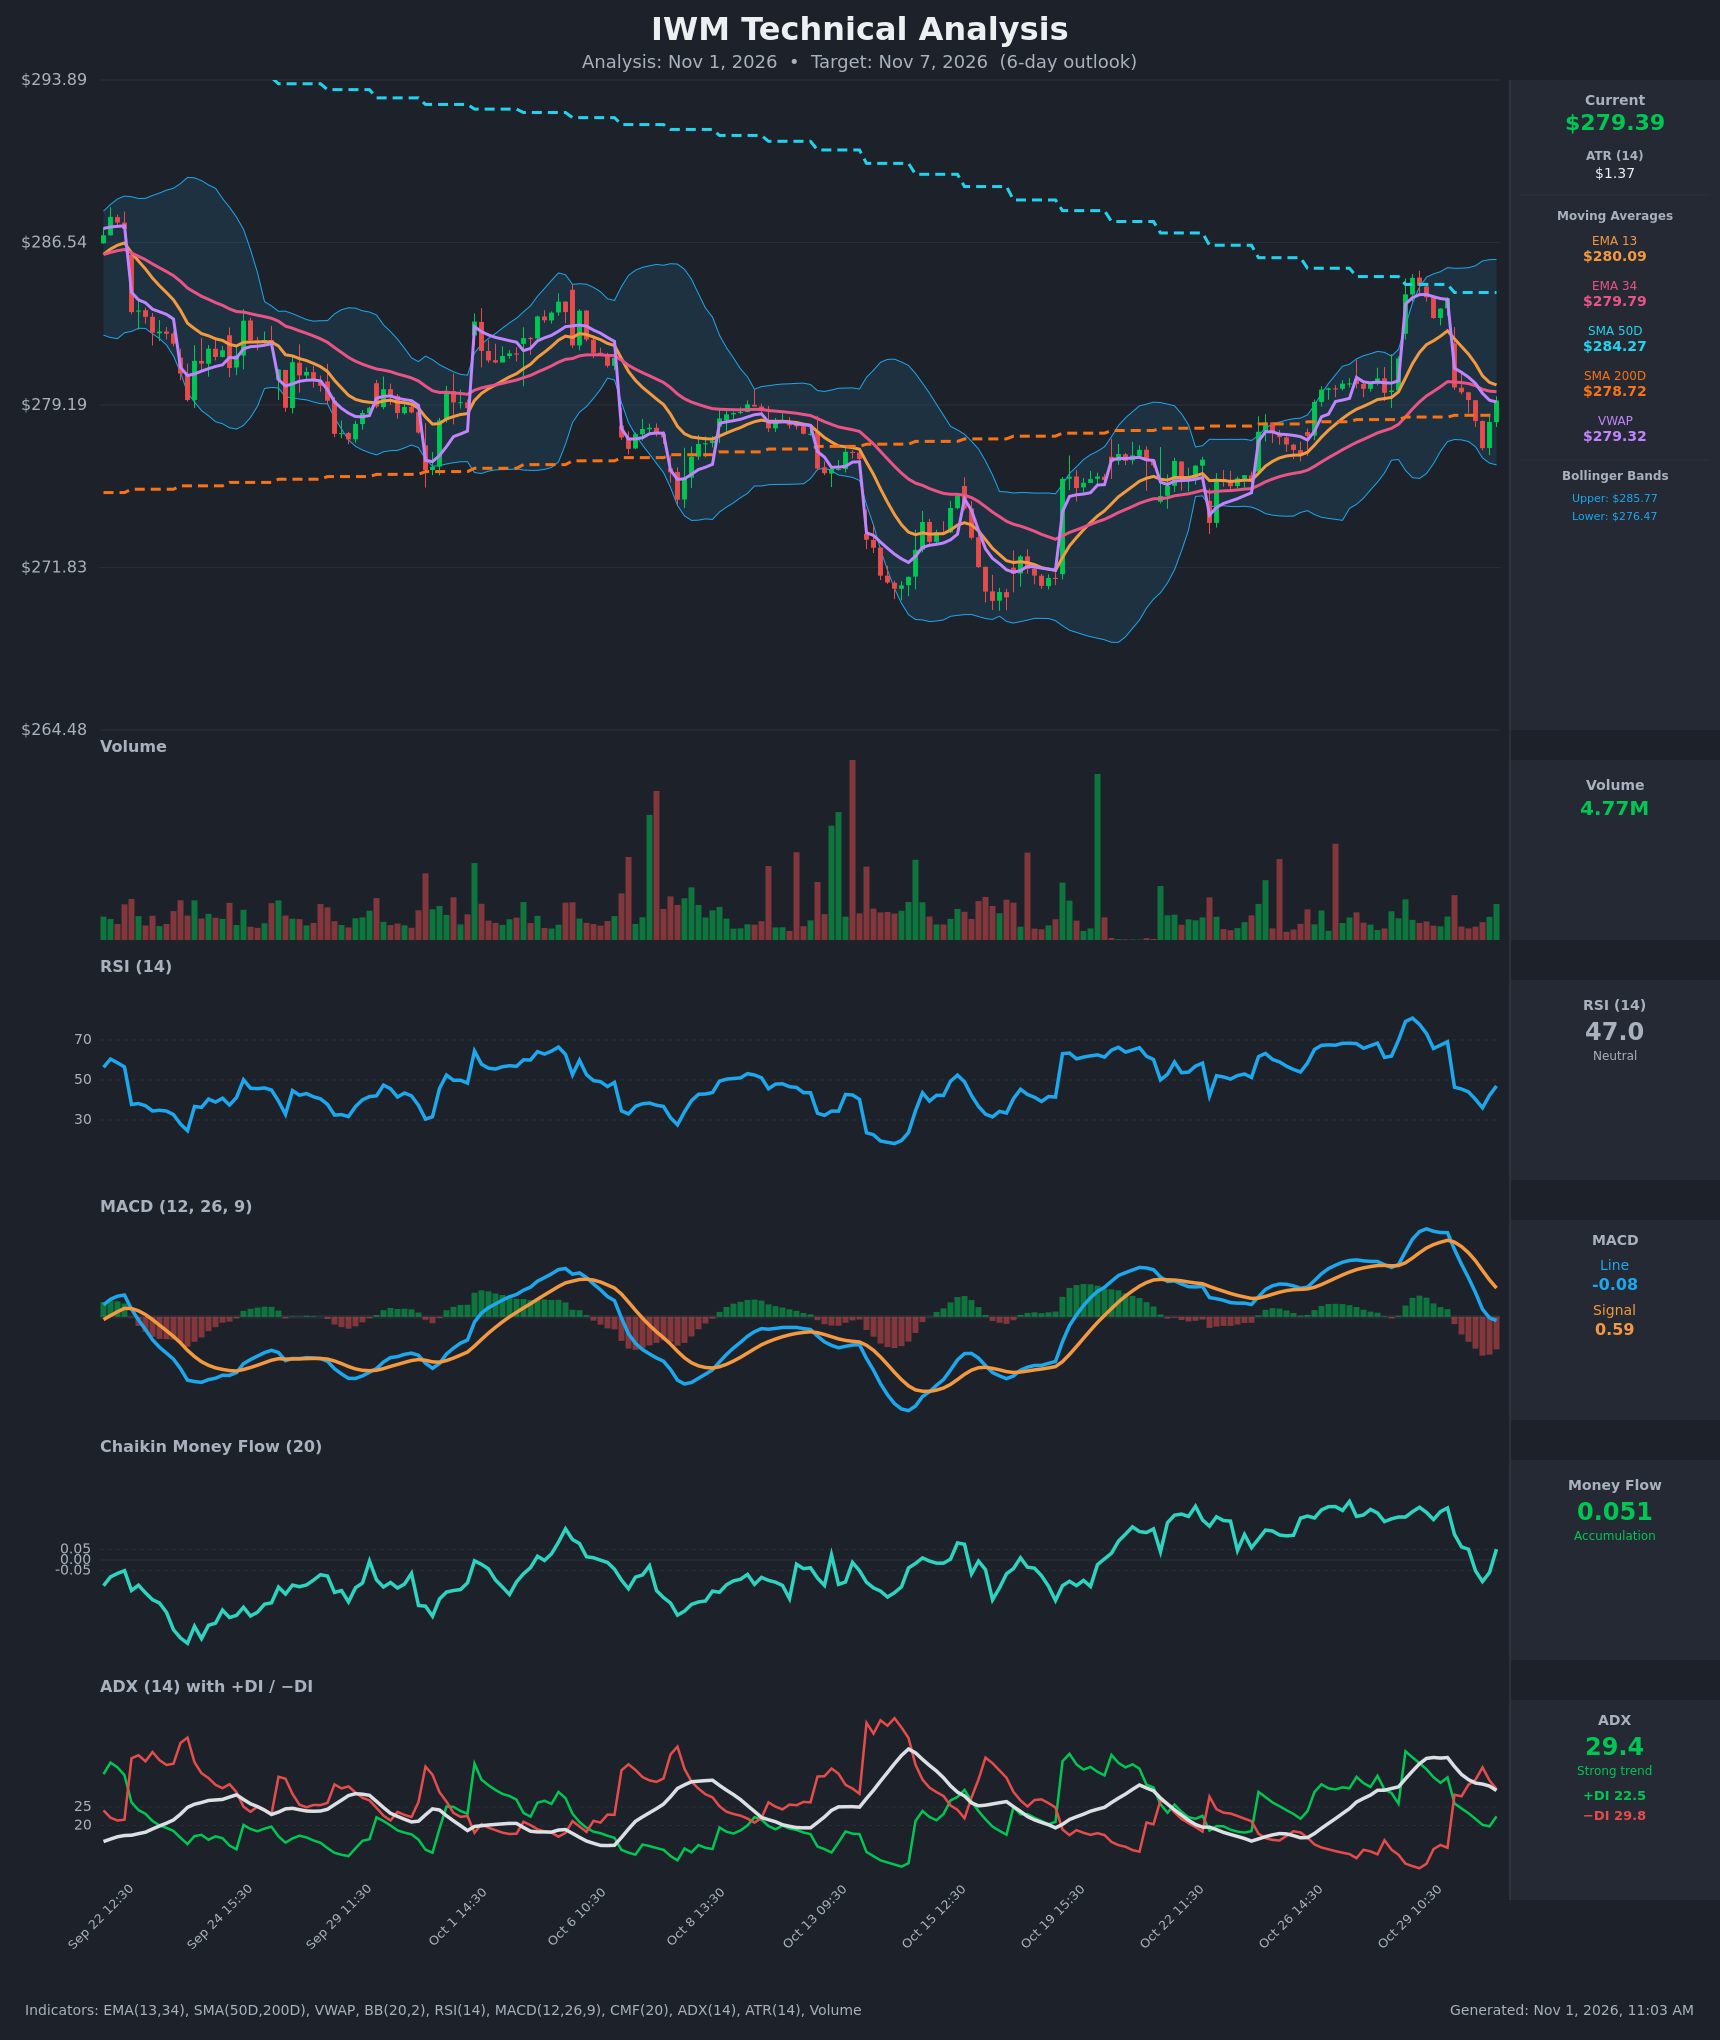
- RSI (14): 47.01, down from 80.9 on Oct 29 and a low of 36.1 on Oct 30 before a small bounce. It sits just under the 50 midline with no oversold or overbought reading. Momentum has reset from extreme overbought and is only partly recovering. [Neutral]
- 20 EMA: The data gives EMA 13 at $280.09 and EMA 34 at $279.79, and price at $279.39 is below both. The EMA13 is rolling over toward the EMA34 and is now only $0.30 above it, so a bearish cross is close. Price is slightly under the short-term dynamic resistance. [Bearish]
- MACD: Line -0.078 against signal 0.586, a histogram of about -0.66. The line crossed below the signal on Oct 30 (1.374 vs 1.524) and has now fallen below zero. The chart shows the histogram turning clearly negative, a fresh bearish momentum signal. [Bearish]
- Bollinger Bands (20): Upper $285.77, lower $276.47, middle about $281.1. Price is in the lower half of the bands, about $2.9 above the lower band. The bands are fairly wide after the Oct 29 spike, so volatility is elevated. The Oct 30 low of $277.23 held above the lower band. [Neutral]
- CMF (20): 0.051, barely above the +0.05 accumulation threshold. It has dropped from about 0.25 and dipped to -0.10 on Oct 30 before the bounce. Buying pressure has faded sharply and the current reading is only marginal. [Neutral]
- ADX (14): 29.4, a strong trend but falling from 38.3. −DI (29.8) is above +DI (22.5), and the DI cross happened on Oct 30. The recent trend, a sharp drop from $284 to $277, is bearish and the sellers currently have control, though trend strength is fading. [Strong Trend – Bearish]
- Volume: 4.77M on the latest bar, in line with or slightly below average, with no capitulation spike. The Oct 30 drop came on ordinary volume, and the bounce shows no strong buying surge. [Neutral]
DIVERGENCES & TRENDS
- There is no clear classic divergence. RSI peaked at 80.9 while price made a modest high at $284.94, which is consistent rather than divergent.
- MACD rolled over from a peak of 1.80 into negative territory in two sessions. CMF fell from 0.25 to roughly neutral. Both show bullish momentum from the Oct 29 breakout failing.
- Price gapped down on Oct 30 from $284.01 to $279.98 and gave up the whole Oct 29 spike. This is a failed breakout above the $284 area, where the SMA50 ($284.27) acted as resistance.
- Moving-average structure is mixed:
- Price is above the SMA200 ($278.72) but below the SMA50 ($284.27).
- SMA50 is above SMA200, so the golden-cross structure is intact.
- The EMA13/34 gap has nearly closed, and a bearish cross is pending.
- Price is sitting on VWAP ($279.32) and the SMA200, a pivot zone that is deciding the next move.
- The final bar bounced from $277.23 and the RSI is curling up from 36. This is a minor relief rally inside a broader bearish momentum shift.
CHART PATTERNS
- Loose Bearish Double Top / failed breakout: Price has been rejected twice in the $284–285 zone, near the SMA50 and the upper Bollinger Band. The neckline is around the $277–278.7 area (the Oct 30 low and SMA200). A break below it would project a measured move of about $7–8, toward the $270–271 area. This is an approximate fit, not a textbook pattern.
- Wider trading range: IWM has traded between roughly $271 and $285 for six weeks. The 6-day horizon sits in the middle of that range, so the range edges cap the extent of any move.
- No confirmed flag or wedge: The current bounce could become a bearish flag or pennant if it stalls under $281, which would favor continuation lower. This has not formed yet.
POTENTIAL SCENARIOS
- Scenario 1: Bearish Continuation Below the SMA200 — Bearish MACD, −DI dominance and the pending EMA13/34 cross favor sellers. The bounce stalls under the EMA13, price loses the SMA200/VWAP and tests the lower Bollinger Band. Trigger: a close below $278.00, then below the Oct 30 low of $277.23. Target: $275.50–276.50, with an extension to about $272. Invalidation: a close above $281.00. (50% probability)
- Scenario 2: Neutral Chop Around the SMA200/VWAP — The $277–281 zone holds as price oscillates around the pivot cluster, with ADX continuing to fade. Trigger: failure to break either $277.2 or $281. Target: $277.5–281.0. Invalidation: a close outside that band. (22% probability)
- Scenario 3: Bullish Relief Rally Back to the SMA50 — Buyers defend the SMA200 and the bounce extends as RSI recovers above 50 and MACD flattens. Trigger: a close above $281.00 (above the EMA13/34 cluster) with a CMF rise above 0.1. Target: $283.5–284.3 (SMA50). Invalidation: a close back below $278.7. (28% probability)
PRICE TARGETS
For the 6-day horizon (about Nov 7), I set a modestly bearish target, a little below the pivot cluster:
- Target Price: $277.40
- Expected Range: $270.80 to $284.20 (width $13.40, about 4.8%, which fits the 4–8% guidance for a 7–10 day window, scaled down slightly for 6 days; ATR of $1.37 supports roughly this daily-noise scale)
- Key Levels: Support at $276.47 (lower Bollinger Band; the SMA200 at $278.72 is the first minor support above it), Resistance at $280.09 (EMA13), with the stronger overhead barrier at $284.27 (SMA50)
OVERALL BIAS
OVERALL BIAS: BEARISH - MACD has crossed bearishly and gone below zero, −DI is above +DI with ADX near 30, CMF has faded to neutral, and price is under the EMA13/34 after a failed breakout at the SMA50. The SMA200 and the Oct 30 low are the key defenses for bulls.
This is educational analysis and not financial advice.