IWM 62-day bullish forecast — Nov 15, 2026
- Bias: Bullish
- Timeframe: 62 days (made Nov 15, 2026, target date Jan 15, 2027)
- Price at analysis: $277.54
- Price target: $285.00
- Expected range: $253.00 – $309.00
- Result: Pending — graded after the close on Jan 15, 2027
Get a free AI analysis of IWM today
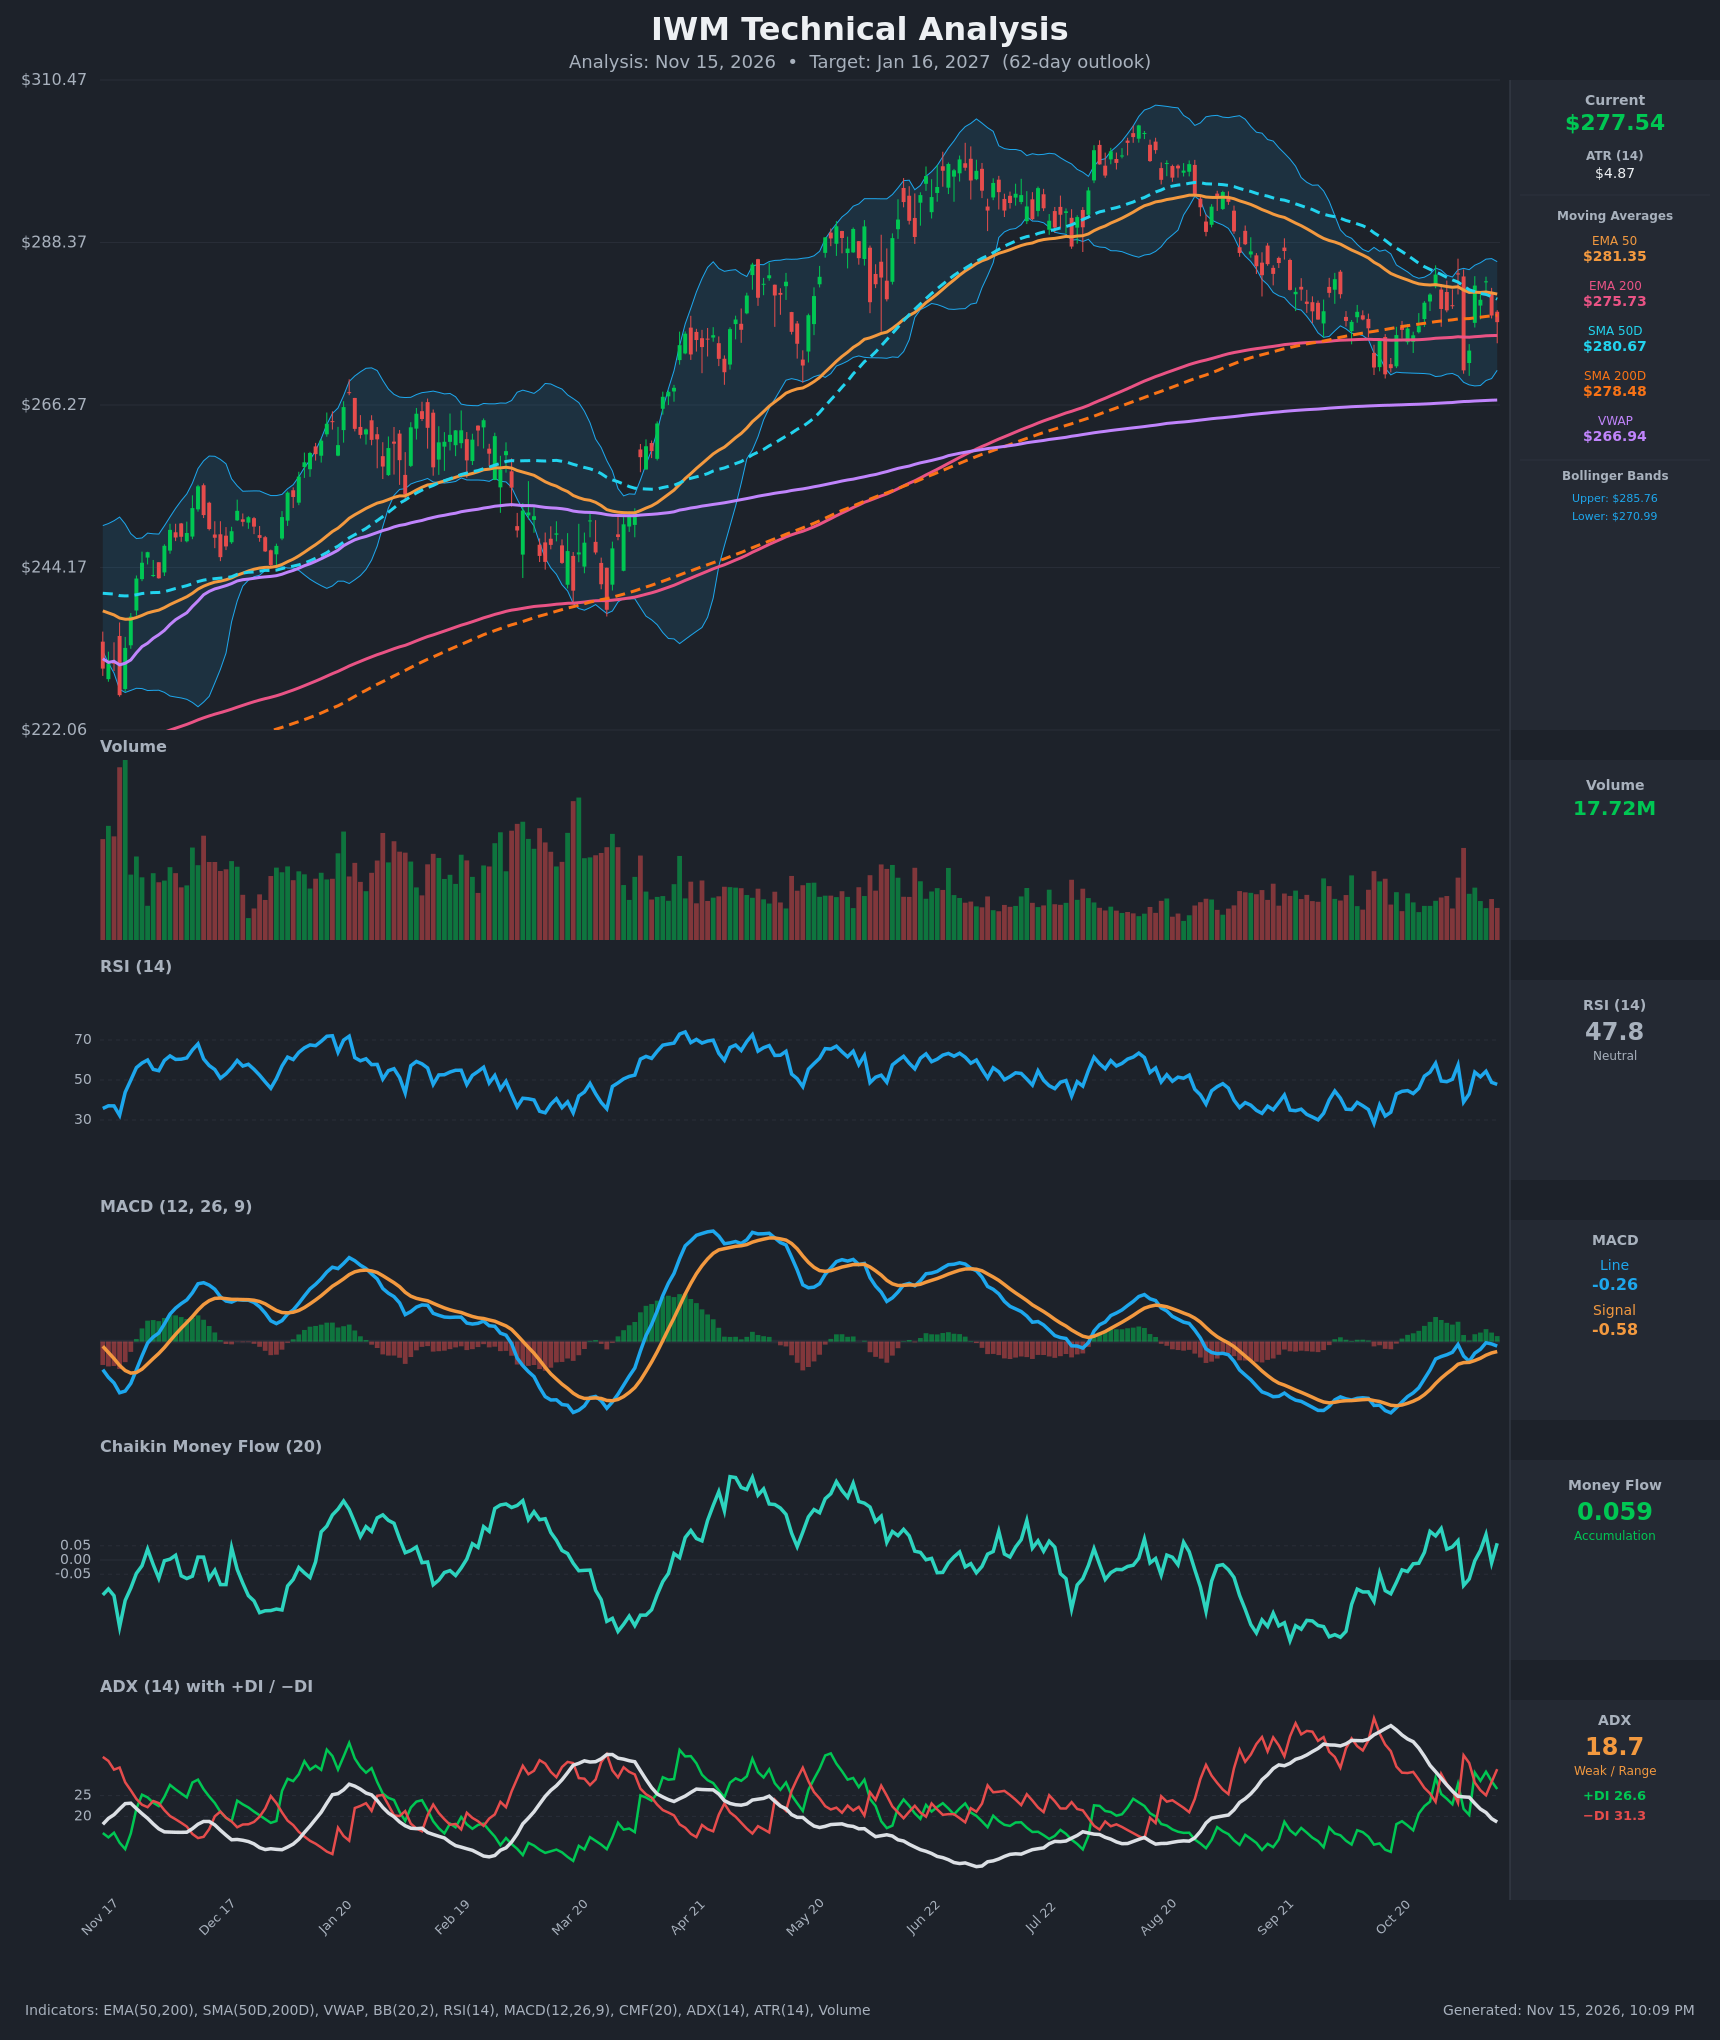
Analysis
TECHNICAL INDICATORS
- RSI (14): 47.81, just under the 50 midline. It has swung between 39 and 58 over the last two weeks without a trend, so momentum is balanced. [Neutral]
- 20 EMA: Not supplied. The EMA 50 is $281.35 and the SMA 50D is $280.67, both just above price and acting as near-term resistance. Price is also below the SMA 200D ($278.48) but above the EMA 200 ($275.73), so it sits in a tangle of long-term averages. [Neutral]
- MACD: Line -0.26 is above signal -0.58, so the histogram is positive (+0.32), but the line is below zero. The line crossed above the signal in early November and has stayed above it. Momentum is improving from a deep trough but not yet decisively positive. [Bullish]
- Bollinger Bands (20): Upper $285.76, lower $270.99, midline about $278.4. Price is slightly below the midline. The bands have narrowed after the Aug-Oct decline, which points to compression and a coming expansion. The Nov 5 flush to $270.98 tagged the lower band and was bought. [Neutral]
- CMF (20): 0.059, just above the +0.05 threshold. It has recovered from negative readings (-0.089 on Nov 5), suggesting mild accumulation on dips. [Accumulation]
- ADX (14): 18.7 and falling from 36 in late October, so the trend is weak. −DI (31.3) is above +DI (26.6), a mild bearish tilt, but with ADX this low the market is range-bound. [Weak Trend, slight bearish DI tilt]
- Volume: 17.72M, in line with recent averages and well below the spikes of earlier in the year. The Nov 5 selloff on higher volume was fully reversed within days, which shows absorption. [Neutral to mildly constructive]
DIVERGENCES & TRENDS
- MACD vs. price: Price made a similar low on Nov 5 ($270.98) to the Oct low (~$270), while MACD and RSI made higher lows. This is a mild bullish divergence.
- Moving averages: The SMA 50D ($280.67) is falling toward the SMA 200D ($278.48). A death cross is possible within weeks if the weakness persists. The EMA 50 is still above the EMA 200 ($281.35 vs. $275.73), so the intermediate trend has not broken.
- Price vs. long-term averages: Price is between the SMA 200D and EMA 200 and well above VWAP ($266.94). The longer-term uptrend from $222 to about $305 is intact, but the Aug-Oct correction has been large.
- ADX and DI: ADX has dropped from 36 to 18.7 as the sell-off lost steam. −DI is still above +DI, so sellers have not fully given up.
- CMF: It has turned from negative (Oct-Nov) to slightly positive, and the CMF trend is improving.
CHART PATTERNS
- Bullish Double Bottom (best fit): Lows near $270-271 (late October and Nov 5) with a neckline around $284-286, which matches the upper Bollinger Band and the Nov 4 high. A close above $286 would project a measured move of roughly $15, to about $300.
- Symmetrical triangle / consolidation: Lower highs and higher lows over the last few weeks inside a $270-$285 range. A breakout in either direction would resolve it, and a decline below $270 would negate the double bottom and point toward the $262-$266 area.
- Bearish Head and Shoulders (a caution): The August top (~$305) followed by lower highs could be read as a larger topping structure, but there is no confirmed neckline break yet.
POTENTIAL SCENARIOS
- Scenario 1: Bullish Double-Bottom Breakout — Support at $270-271 holds, accumulation continues, and price clears the $281-286 resistance cluster (EMA 50, SMA 50D, upper band). Trigger: daily close above $286 with MACD crossing above zero. Target: $295-$300. Invalidation: daily close below $270. (50% probability)
- Scenario 2: Bearish Breakdown / Death Cross — Price fails at the $281 averages, the SMA 50D crosses below the SMA 200D, and support at $270 breaks. Trigger: daily close below $270 with −DI expanding and ADX rising above 25. Target: $258-$263. Invalidation: close back above $283. (30% probability)
- Scenario 3: Neutral Range Chop — Weak ADX keeps price in the $270-$285 range with repeated tests of both edges. Trigger: failure to close outside $270-$286. Target: $275-$282. Invalidation: close outside the range. (20% probability)
PRICE TARGETS
- Target Price: $285.00 (62 days, about +2.7%)
- Expected Range: $253.00 to $309.00 (width $56, about 20% of current price)
- Key Levels: Support at $270.00, Resistance at $285.76
OVERALL BIAS
OVERALL BIAS: BULLISH - The $270 double-bottom area has held, with a mild bullish divergence in MACD and RSI, CMF back in accumulation, and an intact long-term uptrend. The bias is modest, because price is still below the SMA 50D and SMA 200D, −DI leads +DI, and a death cross is a risk.
This is educational analysis and not financial advice.