IWM 20-day bearish forecast — Nov 15, 2026
- Bias: Bearish
- Timeframe: 20 days (made Nov 15, 2026, target date Dec 4, 2026)
- Price at analysis: $277.54
- Price target: $273.50
- Expected range: $262.50 – $288.50
- Result: Pending — graded after the close on Dec 4, 2026
Get a free AI analysis of IWM today
Analysis
TECHNICAL INDICATORS
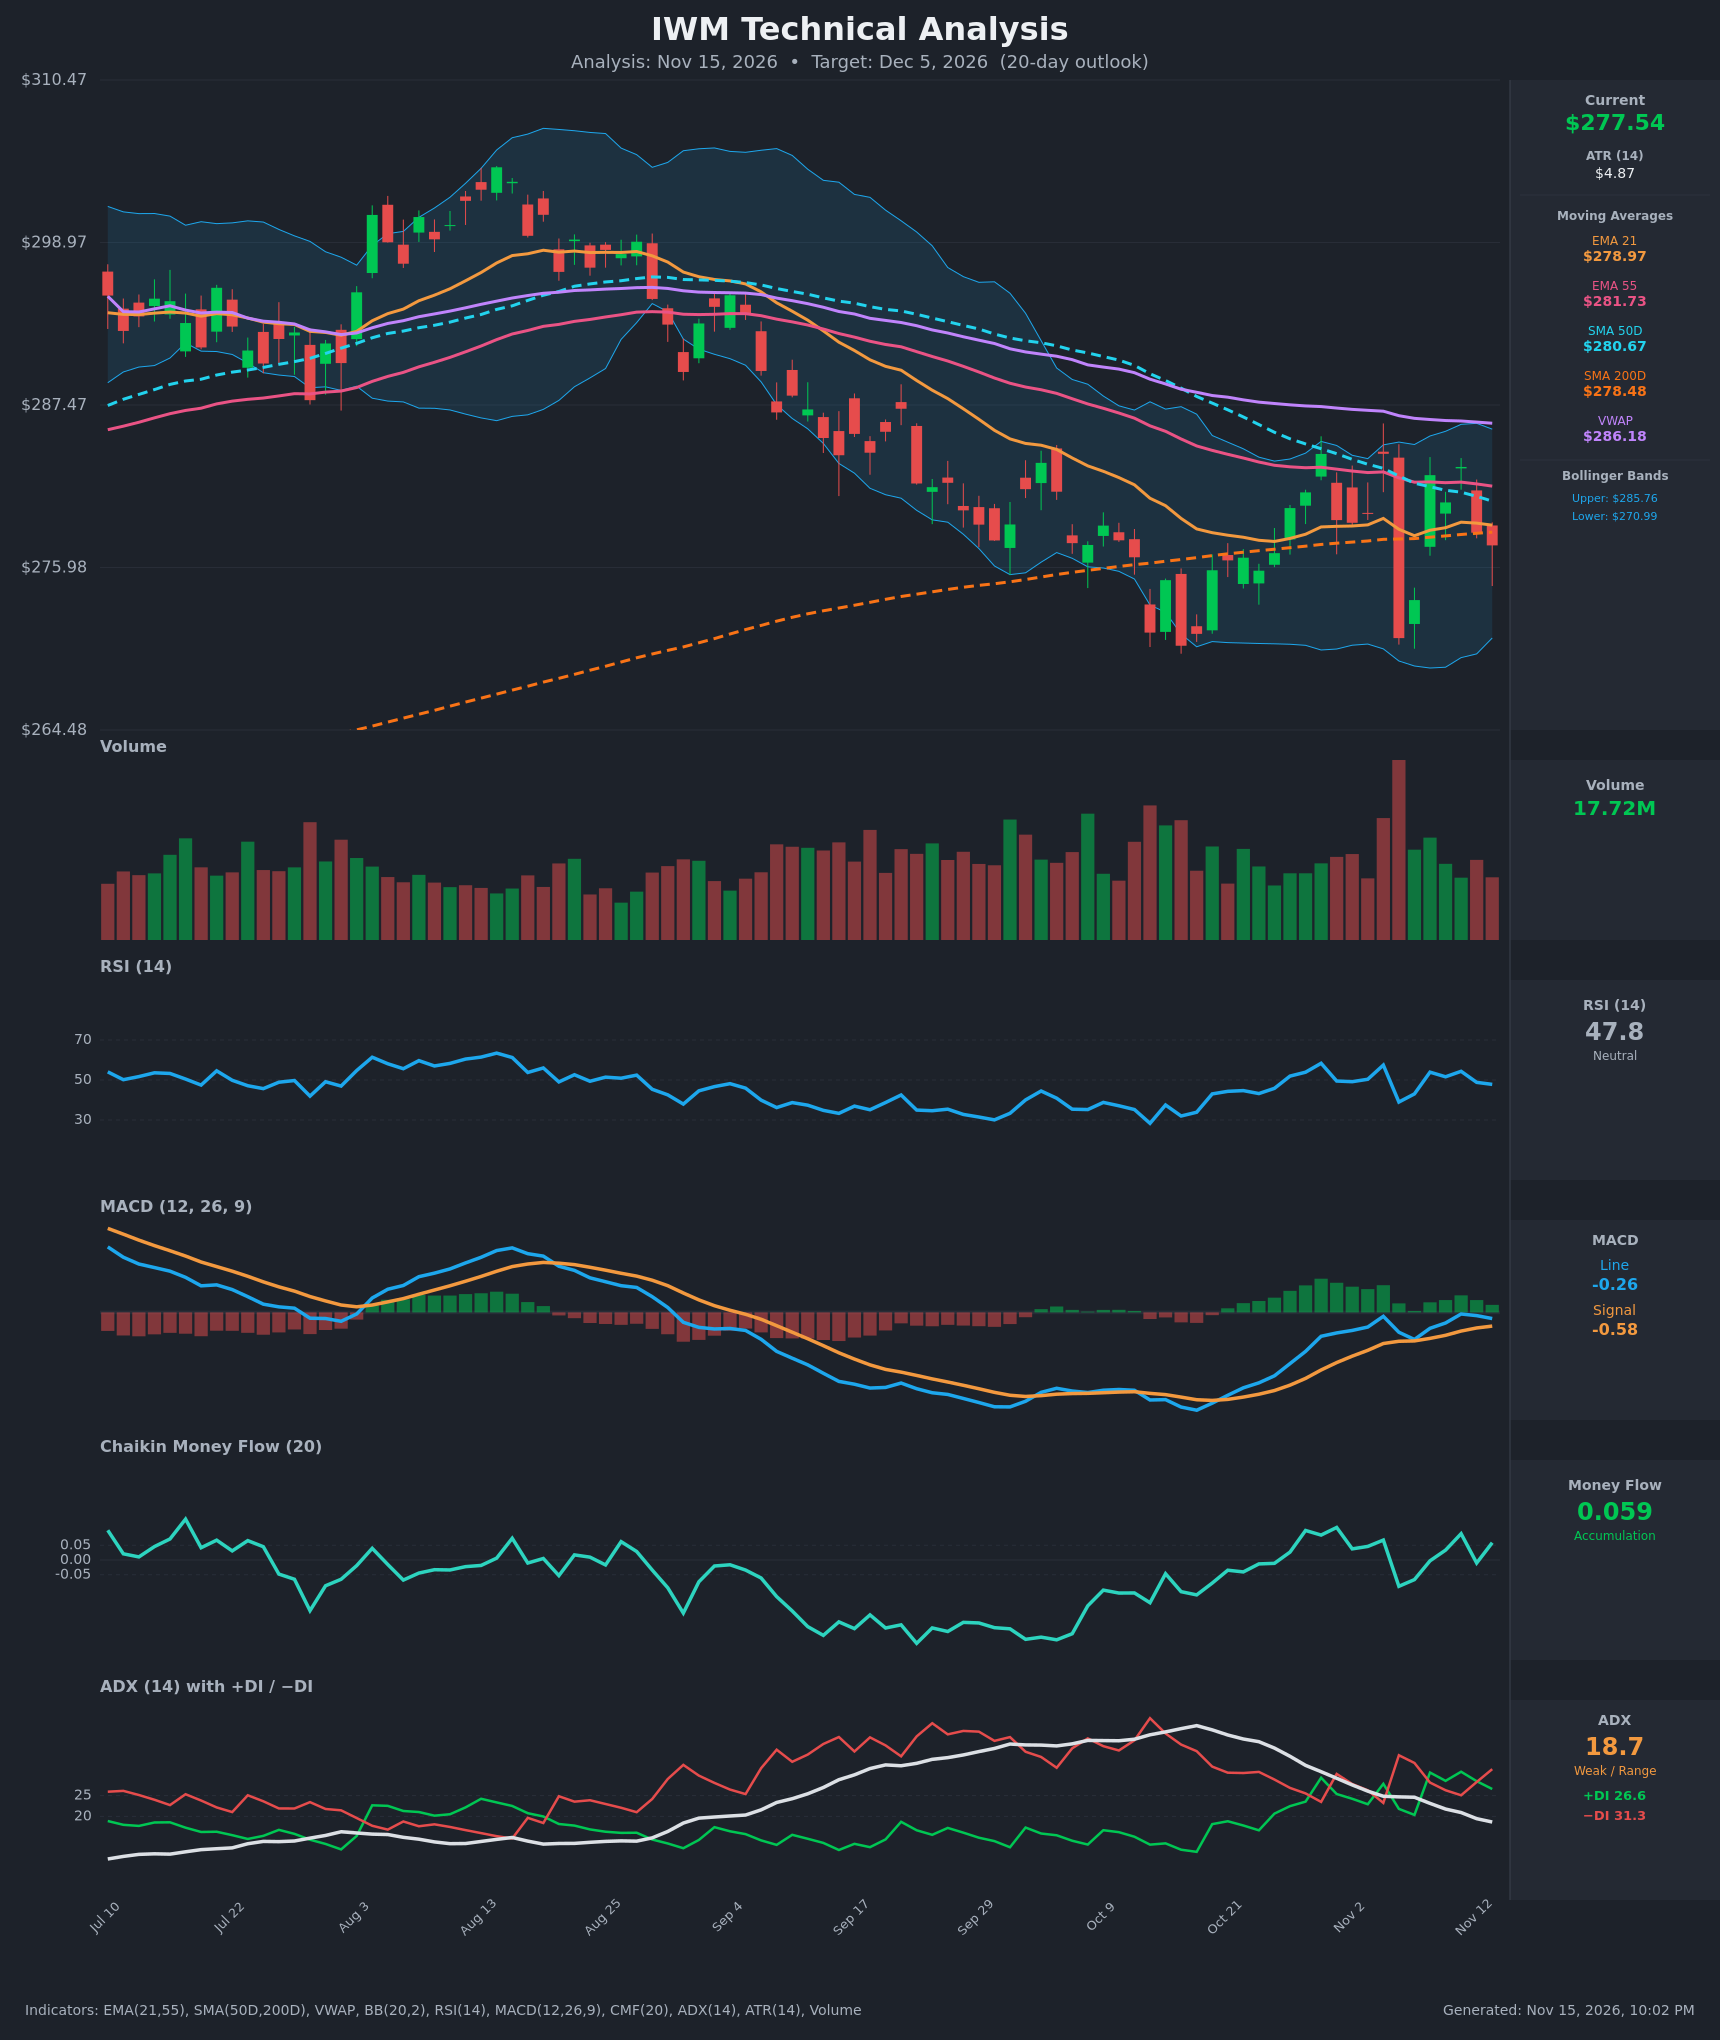
- RSI (14): 47.8, just under the 50 midline. It has pulled back from 54.3 on Nov 11 and is neither overbought nor oversold. The Oct low near 28-30 has recovered, but momentum is stalling below 50. [Neutral]
- 20 EMA (21 EMA: $278.97): Price at $277.54 is below the EMA21, which is now acting as resistance. The EMA21 sits below the EMA55 ($281.73), so the short-term trend remains below the medium-term trend. Price is also below the SMA50 ($280.67) and well below VWAP ($286.18). [Bearish]
- MACD: The line (-0.26) is still above the signal (-0.58) after the early-Nov bullish crossover, so the histogram is marginally positive. But the line is rolling over from -0.07, the histogram is shrinking, and both lines remain below zero. A bearish re-cross looks likely within days unless price bounces. [Neutral/Fading Bullish]
- Bollinger Bands (20): Upper $285.76, lower $270.99, mid about $278.4. Price is slightly below the midline, in the lower half of the bands. The bands are narrowing, which fits the consolidation, and the Nov 5 wick tagged the lower band. [Neutral]
- CMF (20): +0.059, just above the +0.05 accumulation threshold. It has oscillated between -0.09 and +0.11 over the last 15 bars, so buying pressure is marginal and not persistent. It has improved sharply from the deep negative readings of Sep-Oct. [Accumulation (weak)]
- ADX (14): 18.7 and falling from 36.4 on Oct 26, so the Aug-Oct downtrend has lost strength and the market is range-bound. −DI (31.3) is above +DI (26.6), giving bears a slight edge. [Weak Trend, bearish lean]
- Volume: 17.72M, in line with recent averages. The highest-volume bar of the period was a heavy red candle on Nov 5 (the big drop to $270.98), which was a distribution-type bar. The rebound days carried lighter volume. [Mildly Bearish / No Confirmation]
DIVERGENCES & TRENDS
- Price vs. RSI: Price made lower lows in Oct (~$270) while RSI bottomed around 28-30. RSI then recovered to 54-58 and has rolled back to 47.8 without making a new low. That is a mild bullish base, but the recovery lacks follow-through.
- MACD: The bullish crossover around Oct 30-Nov 4 is fading. The histogram peaked in early Nov and is contracting, so momentum is stalling at a lower high.
- Moving averages: The SMA50 ($280.67) is falling toward the SMA200 ($278.48). The gap is only about $2.2 and narrowing by roughly $0.3 per day, so a death cross is likely within 1-2 weeks. The EMA21 is below the EMA55, and price is chopping around the SMA200 (it has closed near it repeatedly).
- ADX/DI: ADX has dropped from 36 to 18.7 while −DI has re-taken the lead over +DI. The downtrend is exhausting, but there is no bullish control yet.
- CMF: The recovery from -0.15 to about 0 is constructive, but CMF is oscillating around zero.
- Price structure: Lower highs have formed since the August peak (~$298 → ~$284). The last month shows a $271-$284 range with two failures near $284.
CHART PATTERNS
- Developing range / possible Bullish Double Bottom: Lows at ~$270 (Oct) and $270.98 (Nov 5) with a neckline near $284. A close above ~$284-285 would confirm it, with a measured target of roughly $298 (neckline + ~$14). That is not confirmed, and volume on the rebounds is unconvincing.
- Larger Bearish structure: Lower highs from August with price capped by the declining EMA55/SMA50/VWAP stack. This resembles a Descending-Triangle/Bearish continuation bias if $271 breaks, with a measured target around $257-260 (range height ~$13 projected down).
- Bollinger squeeze: The bands are narrowing alongside falling ADX, which points to a breakout in the coming weeks. The direction is not yet decided.
- The pattern evidence is balanced, but the overhead moving-average cluster ($278.5-$282) is a heavy lid.
POTENTIAL SCENARIOS
- Scenario 1: Bearish Rejection and Range Break Lower — Price keeps failing at the EMA21/SMA200 zone ($278.5-$279), MACD re-crosses bearishly, and the SMA50/SMA200 death cross prints. Sellers push to retest the lower Bollinger Band and the Oct-Nov lows. Trigger: daily close below ~$275 and then $271. Target: $265-$270, extended to ~$260 on a clean break. Invalidation: daily close above $284 on rising volume. (45% probability)
- Scenario 2: Neutral Range Consolidation — Price keeps oscillating between ~$271 and ~$284, with ADX staying below 20 and the bands tightening. Trigger: closes held between $272 and $283. Target: $274-$281. Invalidation: close outside $270-$285. (30% probability)
- Scenario 3: Bullish Double-Bottom Breakout — CMF stays positive, buyers reclaim the EMA21/SMA200 and push through the $284 neckline. Trigger: close above $284.50 with expanding volume. Target: $290-$298. Invalidation: close back below $278. (25% probability)
PRICE TARGETS
Timeframe: 20 days (through Dec 5, 2026). ATR is $4.87, and a 20-day move of roughly 1.5-2x ATR in either direction is plausible.
- Target Price: $273.50
- Expected Range: $262.50 to $288.50 (width $26.00 ≈ 9.4% of the current price, consistent with the 14-21 day guidance)
- Key Levels: Support at $270.98 (Nov 5 low / lower Bollinger Band), Resistance at $284.00 (range top / double-top highs, above the $278.5-$282 MA cluster)
OVERALL BIAS
OVERALL BIAS: BEARISH - Price sits below the EMA21, EMA55, SMA50 and VWAP, −DI leads +DI, MACD momentum is fading below zero, and a death cross is approaching. CMF and the possible double bottom at ~$271 limit the downside, which is why the target is only modestly below the current price.
This is educational analysis and not financial advice.