IWM 34-day bearish forecast — Nov 15, 2026
- Bias: Bearish
- Timeframe: 34 days (made Nov 15, 2026, target date Dec 18, 2026)
- Price at analysis: $277.54
- Price target: $272.00
- Expected range: $257.00 – $295.00
- Result: Pending — graded after the close on Dec 18, 2026
Get a free AI analysis of IWM today
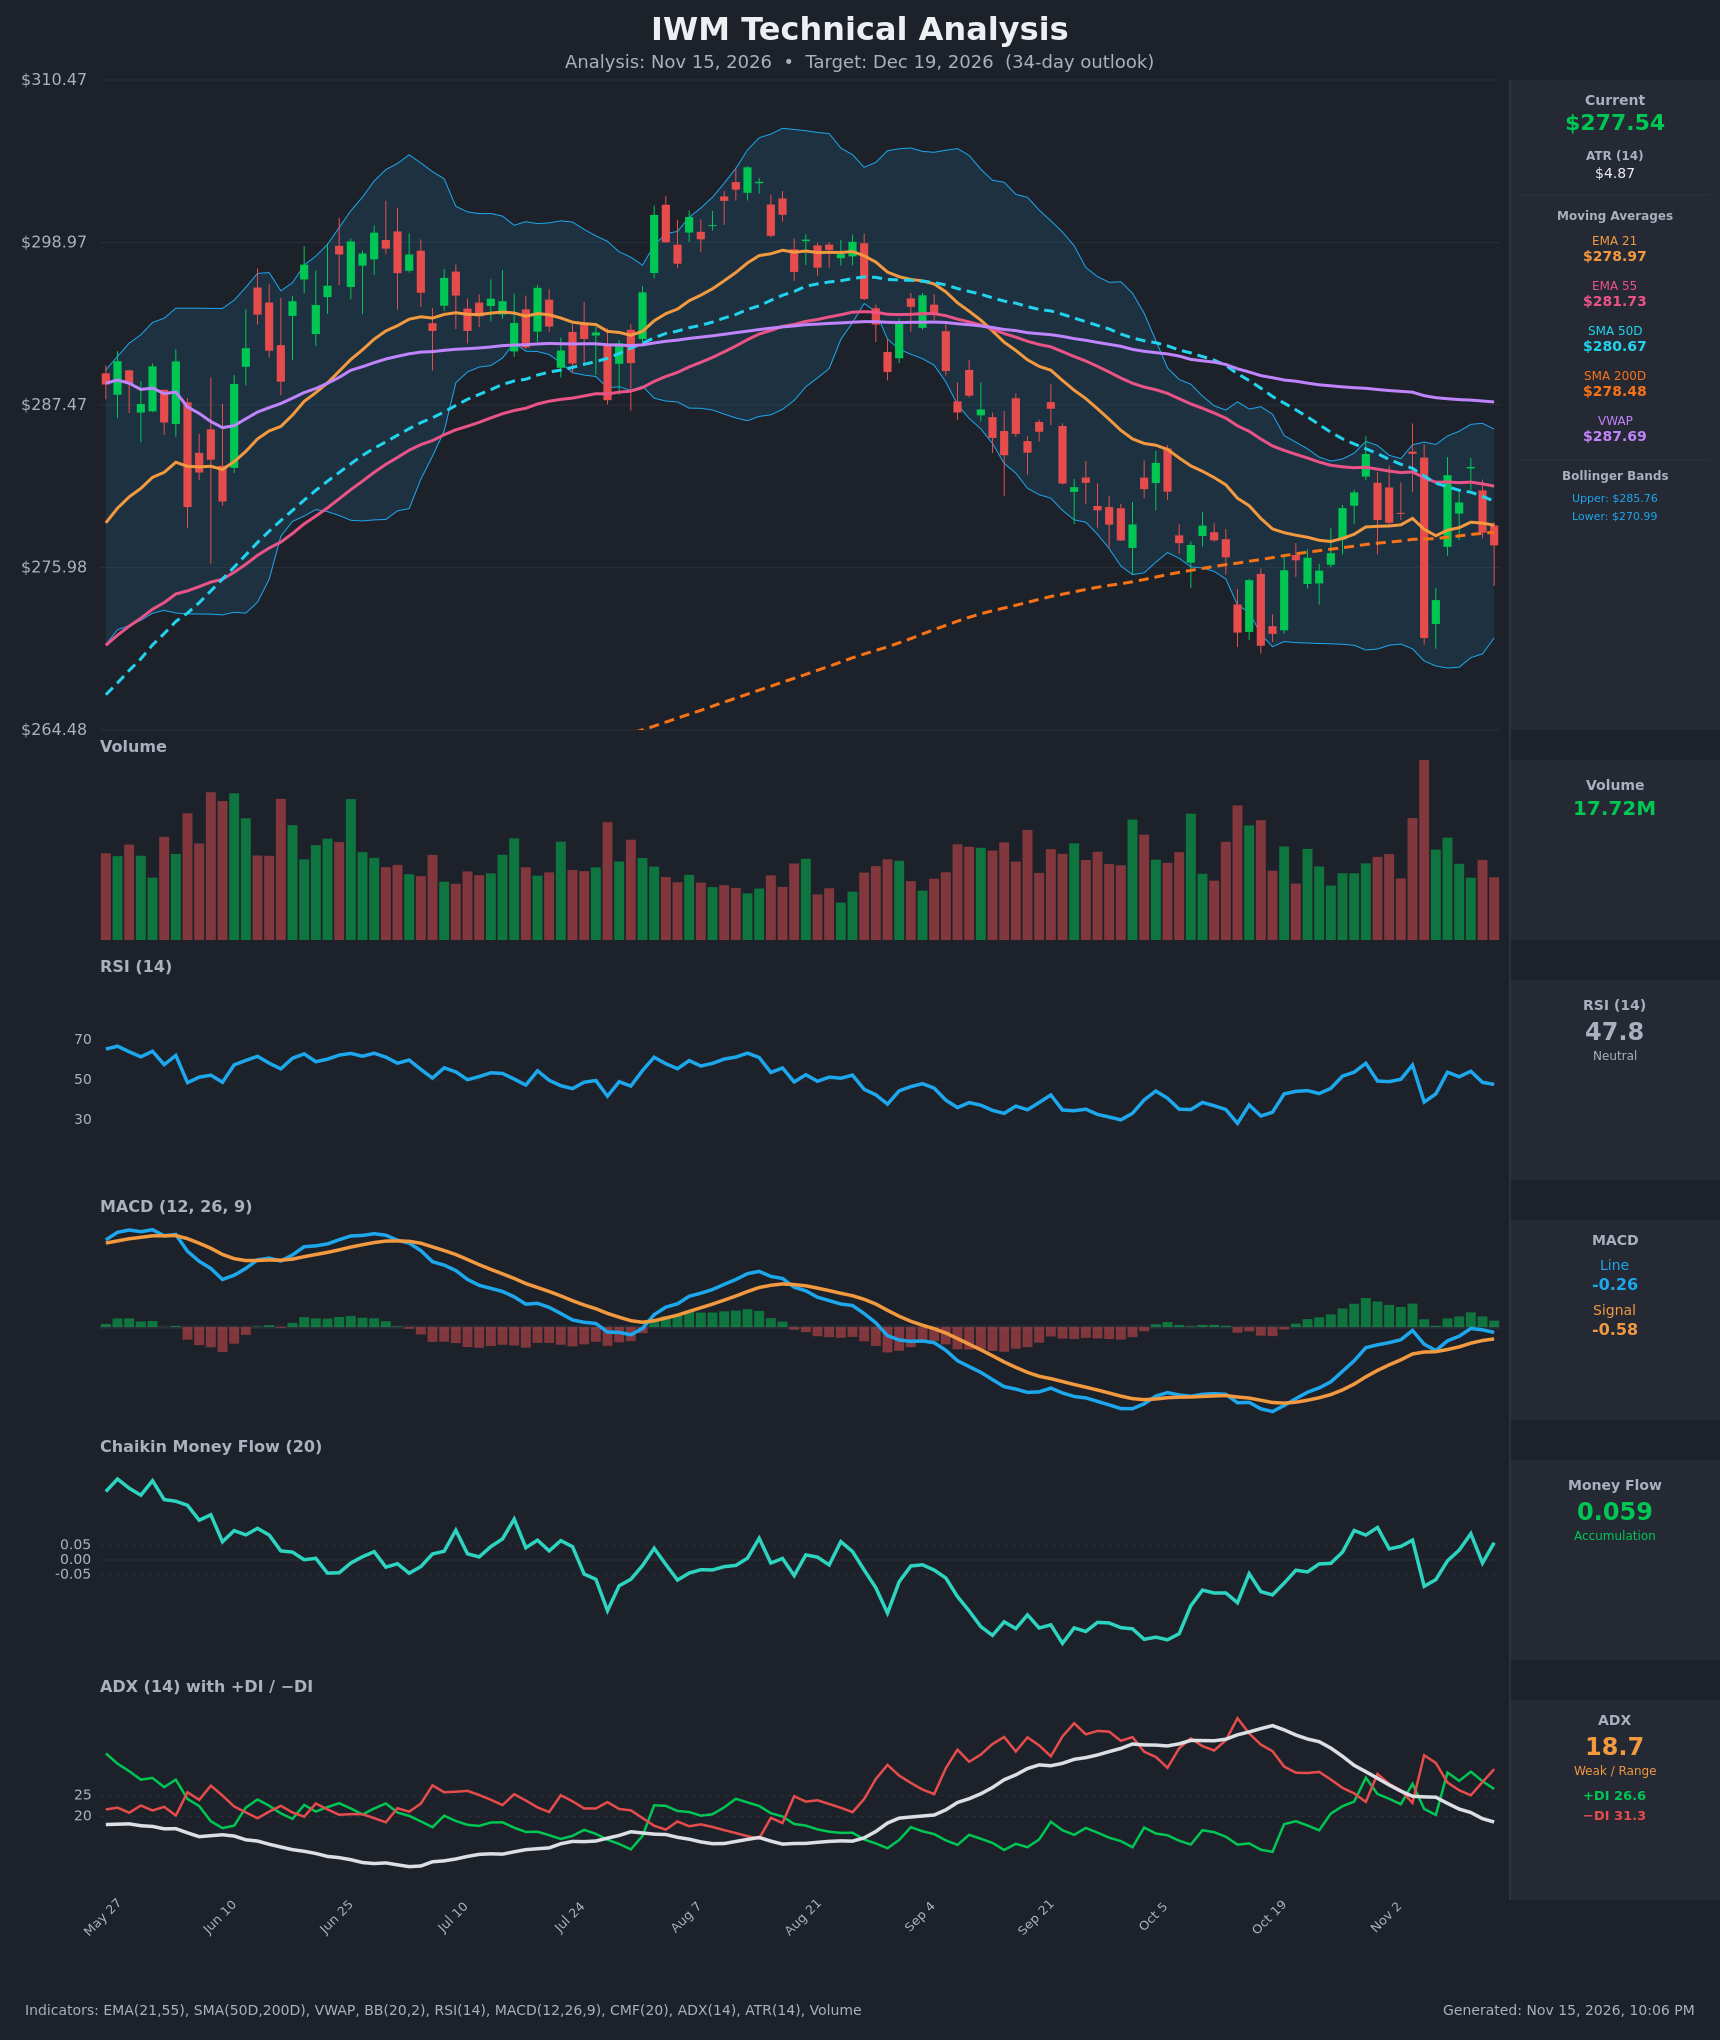
Analysis
TECHNICAL INDICATORS
- RSI (14): 47.81, just under the 50 midline. It has been oscillating between 39 and 58 for two weeks with no directional trend, and it is nowhere near overbought or oversold. [Neutral]
- 20 EMA (EMA 21 = $278.97): Price at $277.54 is below the EMA 21 and has closed under it on 3 of the last 4 bars. EMA 21 is also below EMA 55 ($281.73), so the short-term trend is still down. [Bearish]
- MACD: The line (-0.26) is above the signal (-0.58), a bullish crossover that happened around Nov 4–11. The histogram is slightly positive, but it stalled over the last two bars as the line rolled over (-0.07 to -0.26). Both lines are still below zero. [Neutral]
- Bollinger Bands (20): Upper $285.76, lower $270.99, so price sits just below the midline (~$278.4). Bandwidth has contracted from the Aug–Oct expansion, which points to a volatility squeeze. The Nov 5 flush to the lower band was bought back immediately. [Neutral]
- CMF (20): +0.059, barely above the +0.05 accumulation threshold. It has oscillated around zero for two weeks after a deeply negative stretch in Sep–Oct, so buying pressure is only marginal. [Accumulation]
- ADX (14): 18.7 and falling from 36 three weeks ago, which means a weak trend or range. −DI (31.3) is above +DI (26.6), so sellers keep a slight edge, but the trend has little force. [Weak Trend – slight bearish lean]
- Volume: 17.72M, in line with or a bit below the recent norm. The large spike on the Nov 5 red candle (-4.6% close) was absorbed and partly retraced, which suggests some demand near $270. Volume has otherwise been subdued during the range. [Neutral / mild support at lows]
DIVERGENCES & TRENDS
- Trend structure: Price fell from the ~$300 peak in Aug to the ~$270 low in Oct. Since then it has traded sideways between roughly $270 and $284.
- Moving averages: Price is below EMA 21, EMA 55, SMA 50D ($280.67), SMA 200D ($278.48) and VWAP ($287.69), a bearish alignment. SMA 50D is converging on SMA 200D (gap only ~$2.20 and shrinking about $0.30 per bar), so a death cross looks likely within a couple of weeks unless price rallies.
- Bullish divergence (mild): The MACD low in Oct was well below the current level and price is holding the same ~$270 area, so momentum is improving relative to the lows. The Nov 5 flush also did not push RSI below the Oct trough.
- Failed bounces: Rallies keep failing near $284 (Oct 29, Nov 4, Nov 11), and each failure produced a sharp reversal. The ADX fell from 36 to 18.7 while −DI stayed on top, which fits a decaying downtrend rather than a trend reversal.
- Crossovers: MACD is bullish, but the +DI/−DI cross flipped back to bearish on Nov 12. The EMA 21/55 spread remains negative.
CHART PATTERNS
- Descending triangle / rectangle range (bearish-leaning): The flat support at ~$270 has been tested twice (Oct and Nov 5), while the highs step down from $300 to $284. That matches the Descending Triangle on the reference diagram, a bearish continuation pattern. A close below $270 would project a measured move of roughly $14 (the $284–$270 height), toward ~$256.
- Possible double bottom (bullish alternative): The two lows at ~$270 form a Bullish Double Bottom, but it needs a close above the neckline at ~$284–285 to confirm. That would project toward ~$298–$299.
- MA squeeze: SMA 50D is about to cross below SMA 200D, which would be a death cross and would reinforce the bearish pattern.
POTENTIAL SCENARIOS
- Scenario 1: Bearish Support Breakdown — Price keeps making lower highs under the falling EMAs, then the $270 floor gives way as the SMA 50D/200D death cross completes. Trigger: daily close below $270 with expanding volume and −DI above 30. Target: $262–$256 (the measured move from the descending triangle). Invalidation: daily close above $284.50. (40% probability)
- Scenario 2: Neutral Range Persistence — ADX stays below 20 and price keeps chopping between $270 and $284 with the Bollinger squeeze unresolved. Trigger: repeated rejections at $284 and bounces at $270. Target: $272–$282 at the end of the window. Invalidation: a close outside $268–$286. (30% probability)
- Scenario 3: Bullish Double-Bottom Breakout — Buyers defend $270 again, CMF stays positive, and price reclaims the EMAs and SMAs. Trigger: close above $284.50, which clears EMA 55, SMA 50D and the upper Bollinger Band. Target: $292–$298 (toward the VWAP at $287.69, then the measured move). Invalidation: close below $270. (30% probability)
PRICE TARGETS
- Target Price: $272.00 (34-day horizon, a modest bearish tilt toward the lower end of the range)
- Expected Range: $257.00 to $295.00 (width $38 = ~13.7% of the current price, in line with the 12–18% guidance for a 30–60 day window)
- Key Levels: Support at $270.00, Resistance at $284.50
OVERALL BIAS
OVERALL BIAS: BEARISH - Price sits below all key moving averages and VWAP with −DI above +DI, rallies are stalling at $284 as lower highs, and the descending-triangle structure plus an imminent SMA 50D/200D death cross tilt the odds toward a retest or break of $270. The bias is modest because the MACD is positive and CMF shows marginal accumulation.
This is educational analysis and not financial advice.