IWM 48-day bullish forecast — Nov 15, 2026
- Bias: Bullish
- Timeframe: 48 days (made Nov 15, 2026, target date Jan 1, 2027)
- Price at analysis: $277.54
- Price target: $285.00
- Expected range: $265.00 – $302.00
- Result: Pending — graded after the close on Jan 1, 2027
Get a free AI analysis of IWM today
Analysis
TECHNICAL INDICATORS
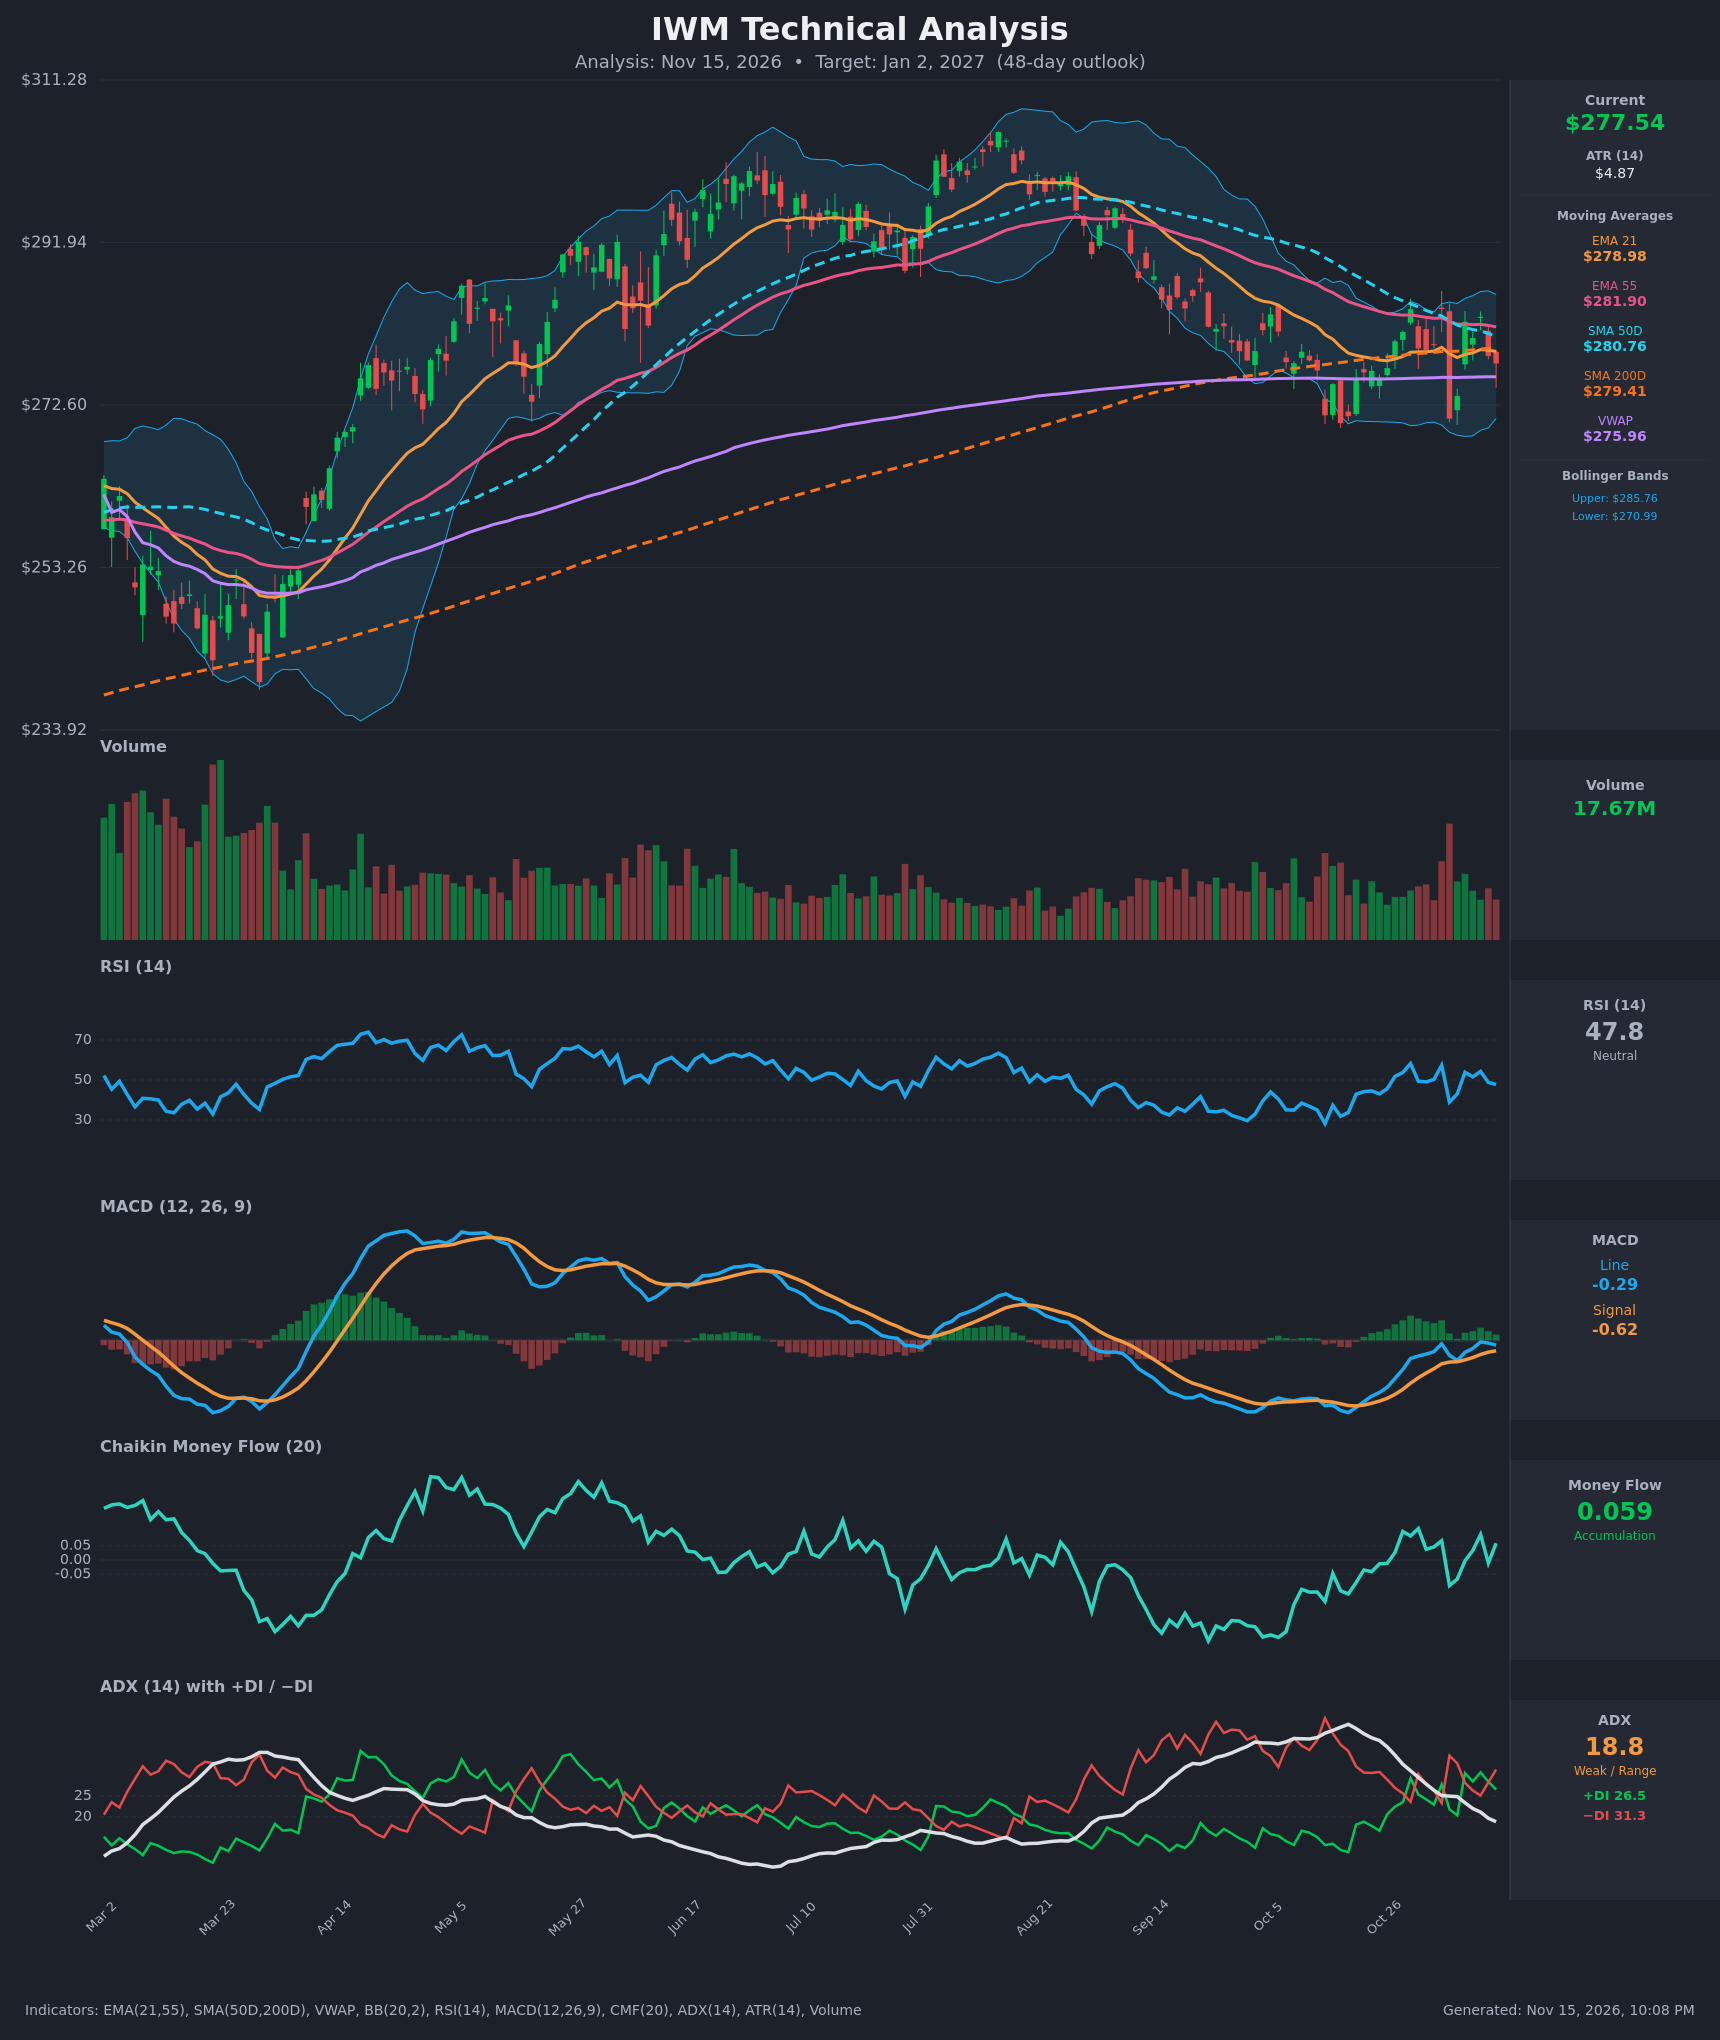
- RSI (14): 47.77, mid-range and neutral. It has chopped between 38 and 58 for three weeks, with no overbought or oversold reading and no clear momentum direction. [Neutral]
- 20 EMA (21 EMA): $278.98, with price at $277.54 just below it. The 21 EMA is flat. It sits below the EMA 55 ($281.90) and SMA50D ($280.76), so overhead MAs form a resistance cluster at $279-$282. [Bearish]
- MACD: Line -0.29 is above Signal -0.62, a bullish crossover that happened around Nov 5-6. The histogram is positive but small, and both lines are still below zero. This is early momentum repair rather than a confirmed trend turn. [Bullish]
- Bollinger Bands (20): Upper $285.76, lower $270.99, midline about $278.4. Price is just below the midline. The bands are fairly narrow after the Nov 5 flush to the lower band, which was quickly rejected, so volatility is compressing. [Neutral]
- CMF (20): 0.059, just above the +0.05 accumulation threshold and recovering from the -0.09 low on Nov 5. Buying pressure is building, but only marginally. [Accumulation]
- ADX (14): 18.8 and falling from 36.8 on Oct 26, so there is no trend (weak/range-bound). −DI (31.3) is above +DI (26.5), a mild bearish tilt with little trend strength behind it. [Weak Trend, slight bearish lean]
- Volume: 17.67M, roughly average. The one high-volume spike was the Nov 5 down bar (-4.6%), which was absorbed by buyers the next day. There is no sign of sustained distribution. [Neutral to mildly supportive]
DIVERGENCES & TRENDS
- Price made a similar low near $270-271 on Nov 5 versus the late-October low near $270. RSI at the Nov 5 low (38.9) was well above its earlier lows near 28-30, a mild bullish RSI divergence.
- CMF has made a series of higher lows since September, from roughly -0.15 to the current +0.059, while price drifted lower. This is a bullish accumulation divergence.
- ADX has fallen from about 37 to 19. The August-October downtrend has lost strength, and the market is shifting into consolidation.
- SMA50D ($280.76) is converging on SMA200D ($279.41), a death cross is possible within days. With the 50-day flattening and price chopping around both, this is a lagging signal and potentially a whipsaw.
- EMA21 is below EMA55, a bearish structure that remains intact. MACD has crossed up, but the lines are still below zero.
- Price is below SMA200D by only $1.87, so the long-term trend is effectively at an inflection point. The long-term SMA200D is still rising.
CHART PATTERNS
- Bullish Double Bottom (reversal): Lows near $270-271 in late October and on Nov 5 form two troughs, with the neckline near $284-$285 (Oct 29 and Nov 4 highs, plus upper Bollinger Band). A close above $285 would give a measured move of about $14-15 (neckline minus trough), or roughly $298-$300.
- Range / symmetrical consolidation: Price is coiling between $270 and $285 as the MAs converge, a mini symmetrical triangle with weak ADX. A breakout is likely within the next few weeks.
- Broader context: The Aug-Oct decline from about $300 looks like a corrective pullback inside the larger uptrend that began in March. A failure below $270 would instead resemble a Bearish Head and Shoulders or a lower-high continuation, and open the $258-$262 area.
POTENTIAL SCENARIOS
- Scenario 1: Bullish Double-Bottom Breakout — Price holds the $270 low, reclaims the MA cluster ($279-$282), and pushes toward the neckline and beyond. Accumulation (CMF) and the MACD cross support this, and year-end seasonality for small caps is favorable. Trigger: daily close above $282 followed by $285.80 (upper BB/neckline). Target: $284-$292 initially, with an extension to about $298. Invalidation: daily close below $270. (45% probability)
- Scenario 2: Bearish Breakdown / Death Cross Follow-Through — Resistance at the MAs holds, −DI stays on top, and the SMA50/SMA200 death cross draws selling. Price loses the Nov 5 low and the lower Bollinger Band. Trigger: daily close below $270. Target: $262-$265, extending to $258. Invalidation: close above $282 on rising volume. (30% probability)
- Scenario 3: Neutral Range Chop — The weak ADX persists and price oscillates between $270 and $285 until the new year. Trigger: continued failed breakouts on both sides. Target: $273-$283. Invalidation: close outside $268-$287. (25% probability)
PRICE TARGETS
For the 48-day horizon (target date about Jan 2, 2027):
- Target Price: $285.00
- Expected Range: $265.00 to $302.00 (width $37 ≈ 13.3% of current price, consistent with the 30-60 day guidance)
- Key Levels: Support at $270.99, Resistance at $285.76
OVERALL BIAS
OVERALL BIAS: BULLISH - A potential double bottom near $270, a bullish MACD crossover, CMF turning to accumulation, and the RSI and CMF higher-low divergences outweigh the overhead MA cluster and the −DI lean. The bullish scenario is the single most probable one, with a measured target of about $285 and upside to about $300 on a neckline breakout. A close below $270 would invalidate this view.
This is educational analysis and not financial advice.