IWM 27-day bearish forecast — Nov 15, 2026
- Bias: Bearish
- Timeframe: 27 days (made Nov 15, 2026, target date Dec 11, 2026)
- Price at analysis: $277.54
- Price target: $273.00
- Expected range: $260.50 – $290.50
- Result: Pending — graded after the close on Dec 11, 2026
Get a free AI analysis of IWM today
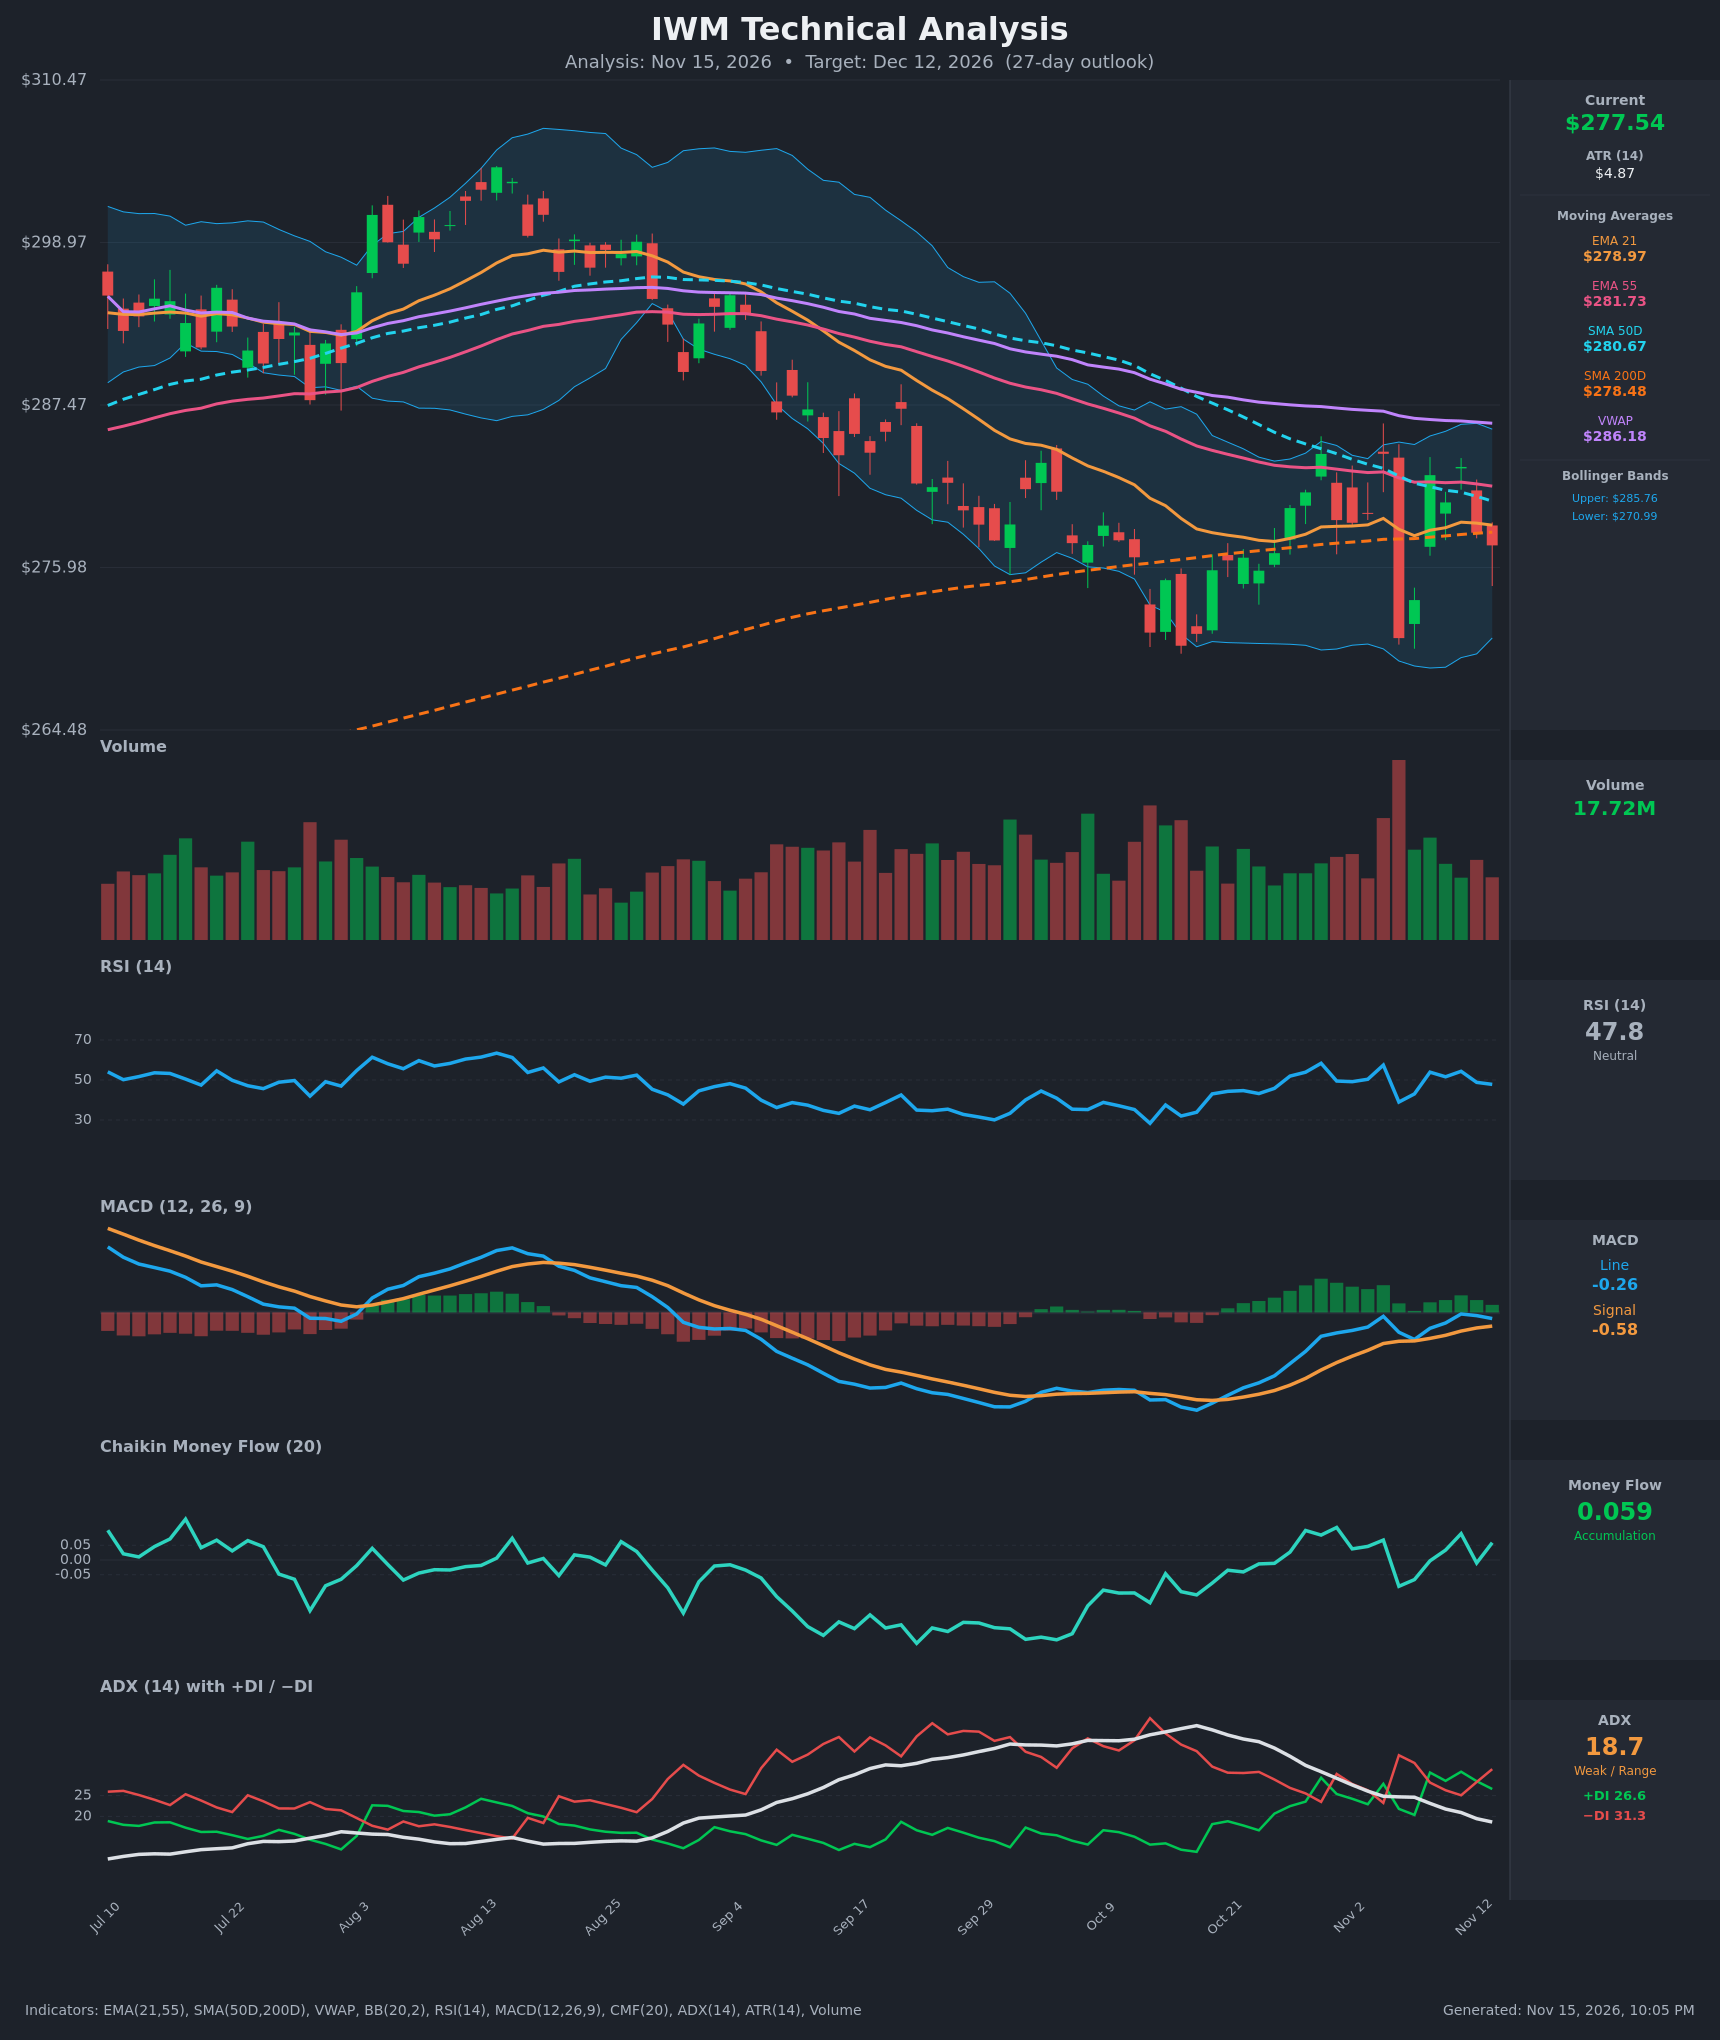
Analysis
TECHNICAL INDICATORS
- RSI (14): 47.8, just below the 50 midline after falling from 54.3 on Nov 11. It is not overbought or oversold, and momentum is drifting slightly lower without any directional edge. [Neutral]
- 20 EMA: The EMA21 is $278.97 and price is $277.54, so price sits just below it and the EMA acts as near-term resistance. Price has been whipsawing around it for two weeks. The EMA21 is also under the EMA55 ($281.73), which keeps the intermediate trend down. [Bearish]
- MACD: The line is -0.26 and the signal is -0.58, so the line is above the signal after a bullish cross around Nov 6. The histogram is positive but shrinking (0.53 on Nov 12 to 0.32 on Nov 13), and the line has turned down again from -0.07. Both lines are still below zero, so this is a weak, fading bounce. [Neutral]
- Bollinger Bands (20): The bands are $270.99 to $285.76, with a midline near $278.4. Price is slightly below the midline, mid-range, and the bands are not especially narrow. There is no squeeze or band-walk signal. The midline is acting as resistance. [Neutral]
- CMF (20): 0.059, barely above the +0.05 threshold. It has oscillated between -0.09 and +0.11 over the last 15 bars, so this is marginal accumulation and not a strong signal. [Accumulation]
- ADX (14): 18.7 and falling from 36 two weeks ago, which means a weak trend or range-bound conditions. −DI (31.3) is above +DI (26.6) and the gap has been widening again over the last two sessions. That is a mild bearish tilt in a weak trend. [Weak Trend, bearish tilt]
- Volume: 17.72M, roughly average. The highest-volume bar was the Nov 5 flush to $270.98, which was a red candle, and the recovery bounces came on lighter volume. Selling volume has been somewhat heavier than buying volume. [Slightly bearish]
DIVERGENCES & TRENDS
- MACD vs price: The MACD made a higher low in October and November while price retested the ~$270 area. This is a mild bullish momentum divergence. The signal is fading, though, because the histogram is shrinking.
- RSI: The Nov 5 low put RSI at 39, well above the ~29 reached in mid-October. That is another mild bullish divergence, but RSI has now rolled over below 50.
- Moving averages: Price is below the EMA21, EMA55, SMA50, VWAP and (marginally) the SMA200 ($278.48). The SMA50 ($280.67) is falling toward the SMA200 and is only about $2.20 above it. A death cross is possible within the window if the decline resumes.
- EMA21 vs EMA55: The EMA21 has stayed below the EMA55 since the August breakdown, with no bullish crossover.
- VWAP: VWAP ($286.18) is far above price and is the overhead anchor for the August–November decline.
- ADX: ADX has rolled over from a peak of about 36 as the downtrend matured. Price is consolidating after the selloff, and the trend is losing steam but has not reversed.
- Overall: The structure shows lower highs ($296 in August, $284 in late October and early November), with support near $270.
CHART PATTERNS
- Double bottom (bullish reversal): There are two lows near $270–271 (mid-October and Nov 5), with a neckline around $284–286. A confirmed break above $286 would target roughly $300. That is not confirmed yet, and the neckline coincides with VWAP and the upper Bollinger Band.
- Range or descending channel (continuation): The larger structure since the August peak is a descending sequence of lower highs. Price is now pinned in a $270–285 range, and the 27-day outlook leans toward a test of the lower boundary before any breakout.
- Pattern targets: A bearish break below $270 would project toward roughly $262–265, based on the range height. A bullish break above $286 would project toward $298–300.
POTENTIAL SCENARIOS
- Scenario 1: Bearish Range Retest and Breakdown — Price is rejected at the EMA21/SMA50 cluster ($279–281), the SMA50 death-crosses the SMA200, and sellers push to the lower band and the Nov 5 low. Trigger: a daily close below $275.50, then below $270.99. Target: $270–$265. Invalidation: a daily close above $282 with MACD turning back up. (45% probability)
- Scenario 2: Bullish Double-Bottom Recovery — Price holds the $270–271 double bottom, the MACD bullish cross holds and CMF stays positive. Price reclaims the moving average cluster and tests the upper Bollinger Band. Trigger: a daily close above $281.75 (EMA55) on rising volume. Target: $285.75–$290. Invalidation: a close below $270. (35% probability)
- Scenario 3: Neutral Range Chop — ADX stays below 20 and price oscillates around the 200-day SMA and EMA21 between roughly $272 and $284. Trigger: failure to break either band edge. Target: $275–$281. Invalidation: a close outside $270–$286. (20% probability)
PRICE TARGETS
- Target Price: $273.00 (Dec 12, 27 days out)
- Expected Range: $260.50 to $290.50 (width $30.00, about 10.8% of current price, in line with the 14–21 day to 30-day guidance and roughly consistent with ATR scaled over 27 days, with a slight downside skew)
- Key Levels: Support at $270.99, Resistance at $280.67
OVERALL BIAS
OVERALL BIAS: BEARISH - Price is below all key moving averages and VWAP, −DI is above +DI, and the structure shows lower highs, with the SMA50 converging down toward the SMA200 for a possible death cross. The positive MACD cross and marginal CMF accumulation are fading, and the double-bottom near $270 gives bulls a credible counter-case, so conviction is modest.
This is educational analysis and not financial advice.