IWM 4-day bearish forecast — Nov 1, 2026
- Bias: Bearish
- Timeframe: 4 days (made Nov 1, 2026, target date Nov 4, 2026)
- Price at analysis: $279.39
- Price target: $277.80
- Expected range: $274.00 – $284.60
- Result: Incorrect (+1.8%) — closed at $284.36 on Nov 4, 2026; quality score 47/100
Get a free AI analysis of IWM today
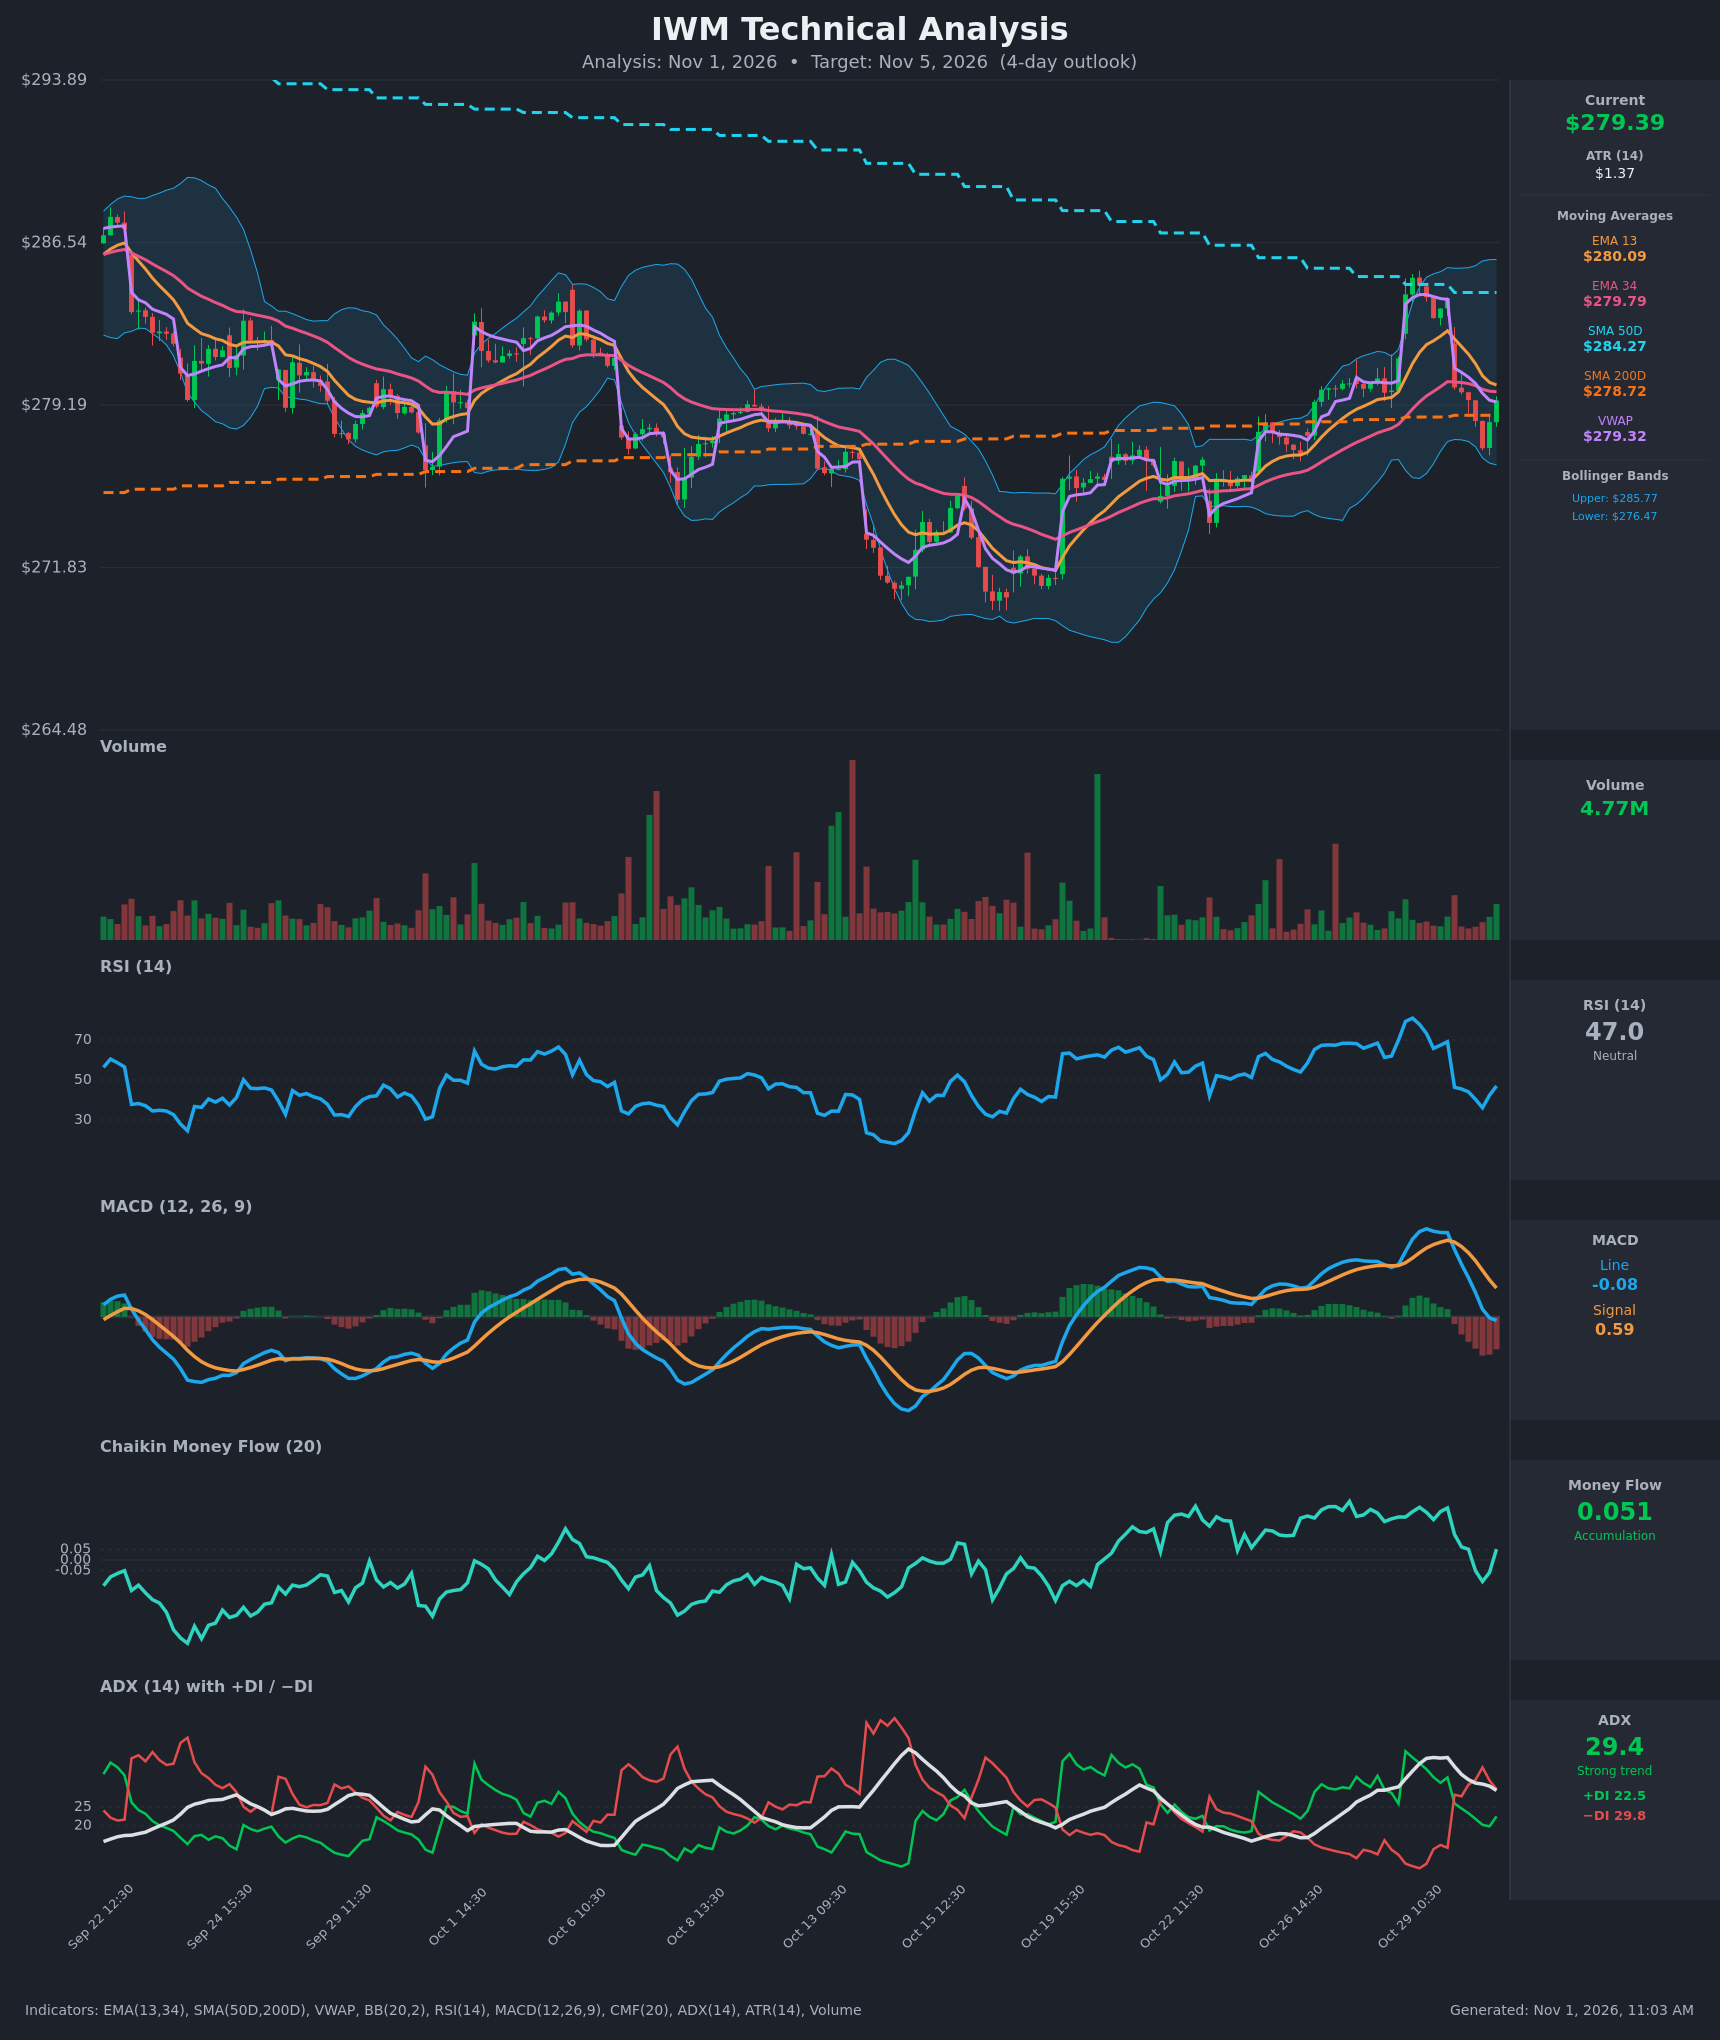
Analysis
TECHNICAL INDICATORS
- RSI (14): 47.01, neutral. It collapsed from about 69 to a low near 36 and has bounced to 47. Momentum is still below the 50 midline, though the bounce is attempting to stabilize. [Neutral]
- 20 EMA: The data gives EMA 13 at $280.09 and EMA 34 at $279.79. Price at $279.39 is below both, and EMA13 has rolled over toward EMA34. The pair is converging and a bearish cross looks likely. Both now act as overhead resistance. [Bearish]
- MACD: Line -0.078 versus signal 0.586. The line crossed below the signal around Oct 30 09:30, and the line itself has dropped below zero. The histogram is negative and has been expanding over the last several bars. [Bearish]
- Bollinger Bands (20): Upper $285.77, lower $276.47, midline about $281.1. Price is in the lower half of the bands, between the midline and the lower band. It failed at the upper half on Oct 29 and snapped back through the middle. The bands are fairly wide, so there is room for movement in either direction. [Bearish]
- CMF (20): 0.051, right at the accumulation threshold. It fell from about 0.25 to -0.10 and has just bounced back. Buying pressure is marginal and fading versus the prior readings. [Neutral]
- ADX (14): 29.4 and falling from a 38 peak, with −DI (29.8) above +DI (22.5). The bears took control on Oct 30 when the DIs crossed. The trend is still strong, but it is weakening, so the downtrend is less established than the DI cross suggests. [Strong Trend – Bearish]
- Volume: 4.77M on the latest bar, which is average to slightly below average. The rebound from $277.23 is on unremarkable volume, so it lacks conviction. [Neutral / Lack of buying confirmation]
Other reference levels:
- SMA 200D: $278.72, just below price. It is the key long-term support.
- SMA 50D: $284.27, well overhead and flat to declining.
- VWAP: $279.32, which price is hovering around.
DIVERGENCES & TRENDS
- There is no clean divergence. RSI and price both rolled over together after the Oct 29 spike to about $285, which was an overbought blow-off (RSI above 80).
- The MACD bearish crossover and the −DI/+DI crossover both occurred on the Oct 30 gap down from about $284 to $280. Both are fresh and confirm each other.
- ADX is declining from 38 to 29. The momentum of the selloff is cooling, which fits the small bounce off $277.23.
- EMA13 is above EMA34 by only $0.30 and the gap is shrinking quickly, so a bearish EMA crossover is imminent.
- The SMA50D ($284.27) remains above the SMA200D ($278.72), so there is no death cross. Price is still above the SMA200D, which preserves the longer-term uptrend and gives dip-buyers a floor.
- The rejection at the $284–285 area, just under the SMA50D, is a failed breakout. The pop and fade resembles a double-top-like rejection at the upper range.
CHART PATTERNS
- Bearish Double Top (loose): The earlier peak near $283–284 and the Oct 29 push to about $285 were both rejected below the SMA50D. The neckline is around $277–278, which is the Oct 30 low area. A decisive break below it projects toward about $270–271 over a longer horizon, though a 4-day window will likely only capture part of that move.
- Bearish Rising Wedge / failed breakout (soft): The advance from Oct 22 to Oct 29 retraced fully in two sessions, which is a typical failed breakout signature. It is not a clean wedge.
- Range context: Price has spent the last several weeks between about $271 and $286, and it is now in the middle-lower part of that range. SMA200 support at $278.72 is the pivot. A hold there favors a bounce toward $281, and a loss favors a move toward the lower band.
POTENTIAL SCENARIOS
- Scenario 1: Bearish Continuation Lower — Price is rejected at the EMA13/EMA34 cluster ($279.80–$280.10), the MACD histogram keeps expanding negatively, and −DI stays on top. Price breaks the SMA200D and retests the Oct 30 low. Trigger: hourly close below $278.70 (SMA200D). Target: $277.20, then $276.50 (lower Bollinger Band). Invalidation: hourly close above $281.10 (Bollinger midline). (50% probability)
- Scenario 2: Bullish Bounce / Dip Buy at SMA200 — The SMA200D holds, CMF stays above 0.05, and RSI reclaims 50. Price recovers the EMAs and fills part of the gap toward $282–$284. Trigger: close above $280.10 with a MACD histogram turn upward. Target: $281.10, then $283.50. Invalidation: close below $277.20. (35% probability)
- Scenario 3: Neutral Chop Around the Moving Averages — Price oscillates between the SMA200D ($278.72) and the EMA cluster ($280.10) as ADX continues to fade. Trigger: no break of either level on closing basis. Target: $278.50–$280.50. Invalidation: a close beyond $277.20 or $281.10. (15% probability)
PRICE TARGETS
- Target Price: $277.80 (4-day horizon)
- Expected Range: $274.00 to $284.60 (width $10.60, about 3.8% of the current price, in line with the guidance for a short 4-day window)
- Key Levels: Support at $278.72 (SMA200D, with the $277.23 Oct 30 low and $276.47 lower Bollinger Band behind it), Resistance at $280.10 (EMA13, with EMA34 at $279.79 just below)
OVERALL BIAS
OVERALL BIAS: BEARISH - A fresh MACD bearish crossover, −DI above +DI with ADX near 30, and price below the EMA13/EMA34 after a failed push to the SMA50D all outweigh the modest bounce and the SMA200D support. Conviction is modest because the ADX is fading, RSI is recovering, and the SMA200D is nearby.
This is educational analysis and not financial advice.