WMT 4-day bullish forecast — Nov 1, 2026
- Bias: Bullish
- Timeframe: 4 days (made Nov 1, 2026, target date Nov 4, 2026)
- Price at analysis: $123.52
- Price target: $124.40
- Expected range: $121.40 – $126.40
- Result: Correct (+4.6%) — closed at $129.26 on Nov 4, 2026; quality score 66/100
Get a free AI analysis of WMT today
Analysis
TECHNICAL INDICATORS
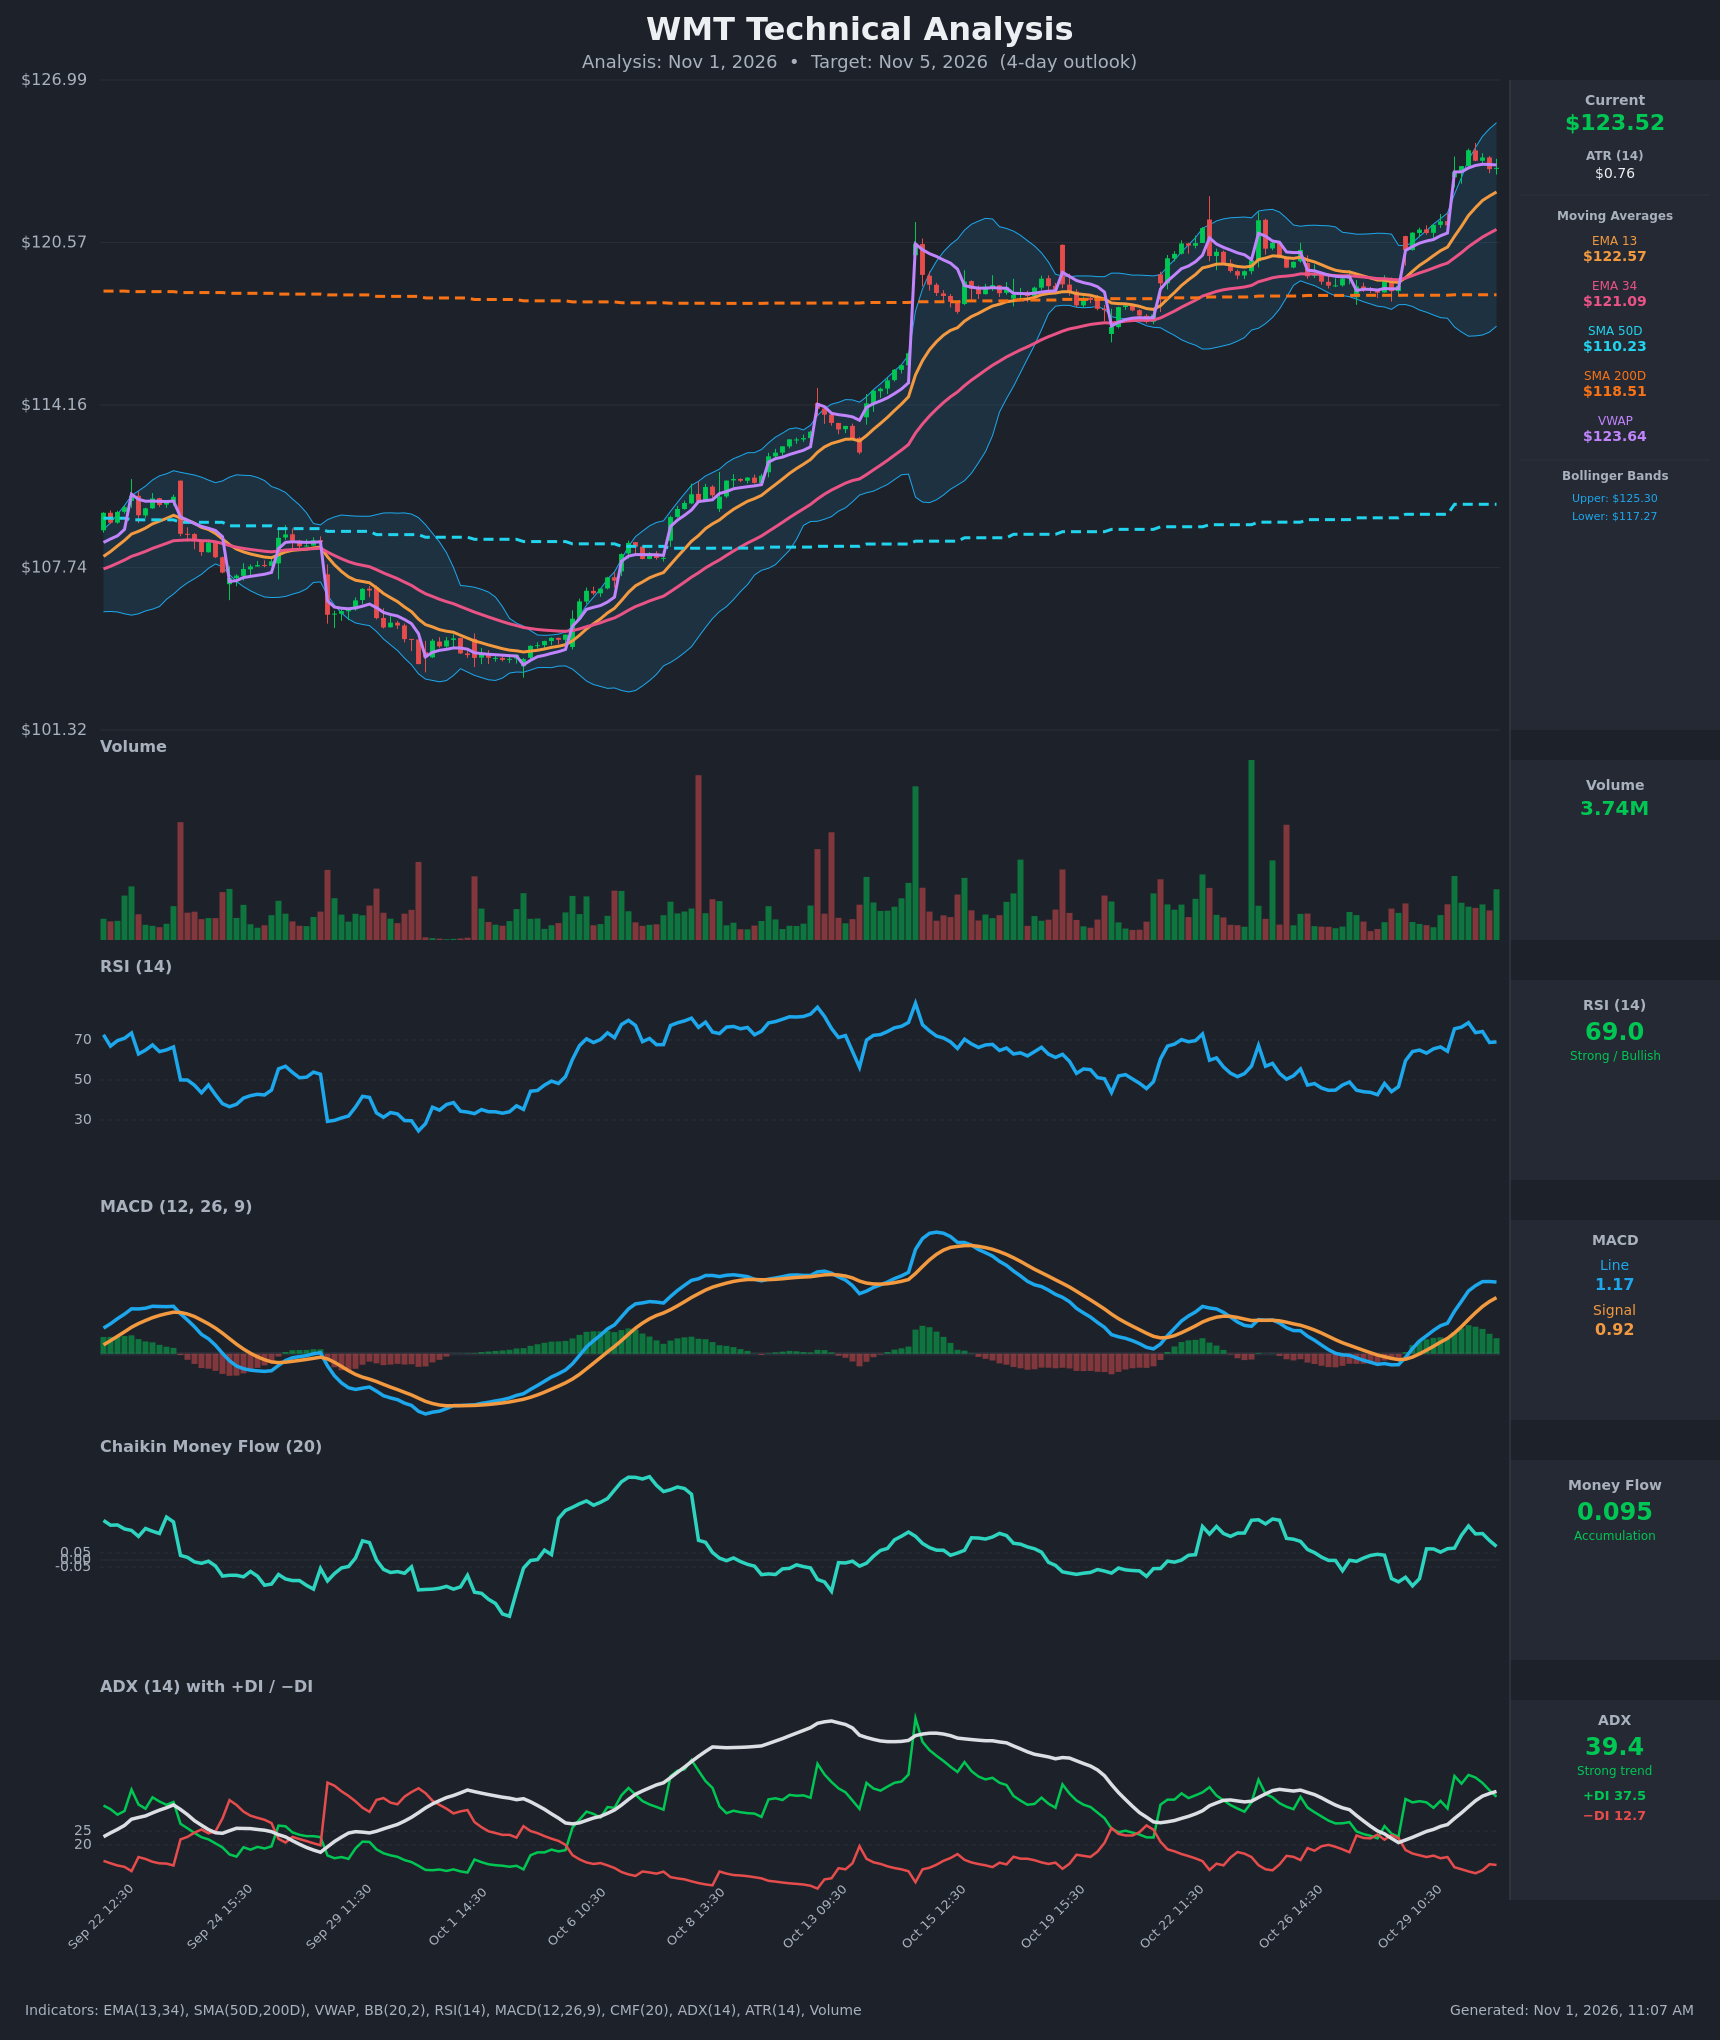
- RSI (14): 69.04, just under the 70 overbought line after peaking near 78.7 on Oct 30. It is pulling back from an extreme but still strong. Momentum is bullish with a minor cooling bias. [Bullish]
- 20 EMA (EMA 13/34 used): EMA13 is $122.57 and EMA34 is $121.09. Price at $123.52 is above both, and EMA13 is above EMA34 with a widening gap. Price is only about $0.95 above EMA13, so the EMA13 is the first dynamic support. [Bullish]
- MACD: Line 1.171, signal 0.917, positive spread of about 0.25. The line crossed above the signal on Oct 29 and has been rising. The last two bars show the line flattening (1.180 → 1.171) while the signal catches up, so the histogram is starting to shrink. [Bullish]
- Bollinger Bands (20): Upper $125.30, lower $117.27, midline about $121.29. Price is in the upper third, about $1.78 below the upper band. The bands are wide, and the stock has been riding the upper half after the breakout. [Bullish]
- CMF (20): 0.095, above the +0.05 threshold but down from 0.240 on Oct 30 at 11:30. Accumulation persists, though it is fading. [Accumulation]
- ADX (14): 39.4 and rising, with +DI 37.5 well above −DI 12.7. This is a strong uptrend. +DI has slipped from 45 and ADX is approaching a mature level. [Strong Trend – Bullish]
- Volume: 3.74M, about average with no climactic spike on the breakout. Volume was modest on the last bars, so the advance is not showing heavy conviction. Price is trading roughly at VWAP ($123.64), a neutral reading. [Neutral / Mildly supportive]
DIVERGENCES & TRENDS
- Price is making higher highs while RSI peaked at 78.7 and has cooled to 69. That is a mild momentum cooling, not a full bearish divergence.
- The MACD line has flattened, and the histogram is likely to shrink in the short term. This is an early sign of consolidation.
- CMF has declined from 0.24 to 0.095 while price held flat near $123.5–124. This is a mild fade in buying pressure.
- The EMA13 is above EMA34, price is far above the SMA50D ($110.23), and price is above the SMA200D ($118.51). The long-term trend is bullish. The SMA50D is still below the SMA200D (no golden cross yet), but the gap is closing.
- ADX is rising above 25 with +DI dominant, which confirms the trend.
- Price sits at VWAP, so there is no strong intraday edge for either side.
CHART PATTERNS
- The chart shows a gap/breakout from the $118–121 range into new highs near $124–125. This resembles a bullish flag/pennant continuation after the strong Oct 30 impulse. Price is consolidating tightly at $123.4–124.2 over the last six hours.
- The prior multi-week range of $118–121 formed a base that resembles an ascending triangle breakout, and that resistance (~$121) now acts as support.
- Flag-type measured move: the impulse from about $121.25 to $124.22 is about $3, which projects roughly $126–127 on a breakout above $124.25. The upper Bollinger Band at $125.30 is the nearest hurdle.
- No reversal pattern (double top or head and shoulders) is confirmed.
POTENTIAL SCENARIOS
- Scenario 1: Bullish Flag Breakout Continuation — Price holds above EMA13 and breaks the $124.25 high, driven by the strong ADX and +DI dominance. Trigger: close above $124.30 on rising volume. Target: $125.50–$126.50. Invalidation: close below $122.50 (EMA13). (50% probability)
- Scenario 2: Neutral Consolidation Near Highs — RSI cools off while price digests the gains between VWAP and the EMA13, with the MACD histogram shrinking. Trigger: failure to break $124.25 and support holding at $122.50. Target: $122.50–$124.50 range. Invalidation: a break outside $122.30–$125.30. (30% probability)
- Scenario 3: Bearish Pullback to Gap Support — Overbought RSI and fading CMF lead to profit-taking toward the mid-Bollinger band and prior breakout zone. Trigger: close below $122.50. Target: $121.10–$121.30 (EMA34 / mid-band). Invalidation: reclaim of $123.80. (20% probability)
PRICE TARGETS
For a 4-day timeframe, the range should be about 3–5% of price (about $4–6), scaled with ATR ($0.76 × √4 ≈ $1.5 per standard move).
- Target Price: $124.40 (4 days)
- Expected Range: $121.40 to $126.40 (width $5.00 ≈ 4.0%)
- Key Levels: Support at $122.57 (EMA13), Resistance at $125.30 (upper Bollinger Band)
OVERALL BIAS
OVERALL BIAS: BULLISH - ADX is strong at 39.4 with +DI far above −DI, price is above all key moving averages and the EMAs are stacked bullishly, and the MACD is positive with CMF still showing accumulation. The cooling RSI near 69 and the flattening MACD suggest a modest pace with possible consolidation before further upside toward $125–126.
This is educational analysis and not financial advice.