QQQ 6-day bullish forecast — Nov 1, 2026
- Bias: Bullish
- Timeframe: 6 days (made Nov 1, 2026, target date Nov 6, 2026)
- Price at analysis: $690.56
- Price target: $696.00
- Expected range: $673.00 – $714.00
- Result: Incorrect (-4.8%) — closed at $657.38 on Nov 6, 2026; quality score 13/100
Get a free AI analysis of QQQ today
Analysis
TECHNICAL INDICATORS
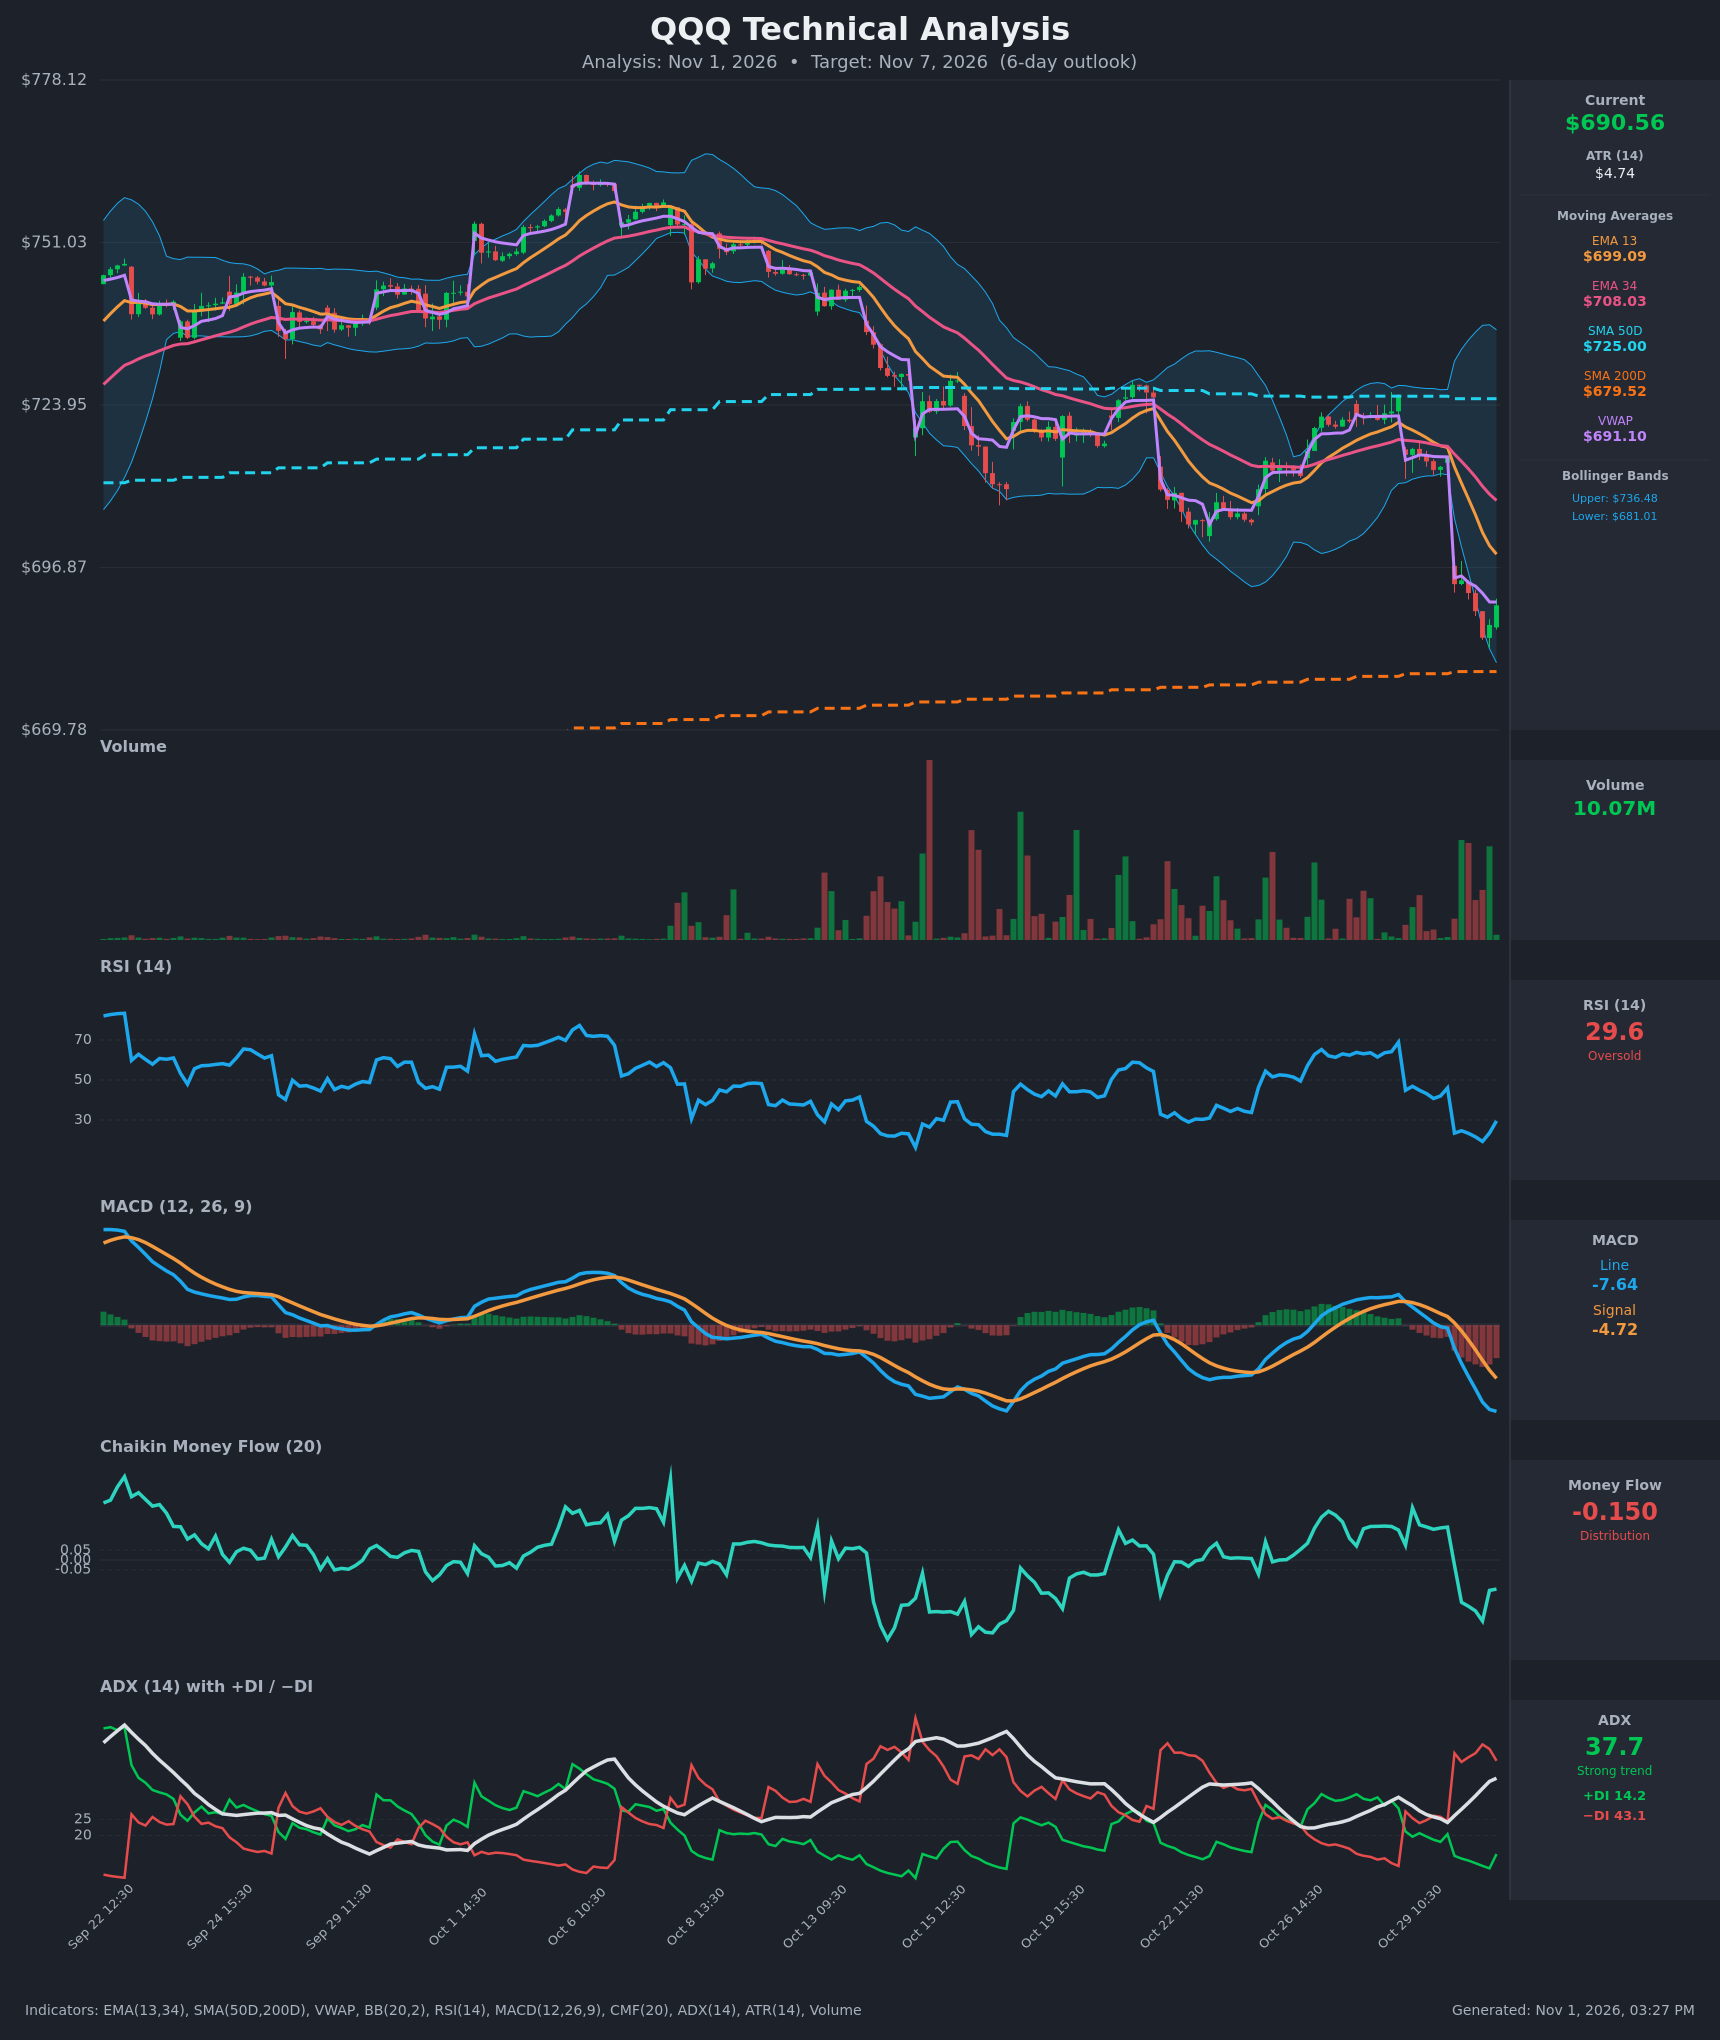
- RSI (14): 29.56, recovering from a low of 19.3 on Oct 30 13:30 and back near the oversold threshold. Momentum is turning up from an extreme, but the reading is still below 30 and well below the 50 midline. [Bullish]
- 20 EMA: The supplied exponential averages are EMA 13 at $699.09 and EMA 34 at $708.03. Price at $690.56 sits below both, and both are sloping down, so they act as overhead resistance. EMA 13 is below EMA 34, a bearish alignment. [Bearish]
- MACD: Line -7.64 is below signal -4.72, with a widening negative histogram. The bearish crossover happened on Oct 29 14:30 and the gap is still widening. The MACD line is stretched, which raises the odds of a bounce, but momentum has not turned. [Bearish]
- Bollinger Bands (20): Upper $736.48, lower $681.01, with the bands wide after the gap-down. Price ($690.56) is in the lower quarter of the bands, having bounced off a low near $685 and not far above the lower band. The lower band, with the $679.52 SMA200 just below it, forms a support cluster. [Neutral]
- CMF (20): -0.150, well below -0.05 and falling sharply from positive readings a few days ago. This shows clear distribution and selling pressure. [Distribution]
- ADX (14): 37.7 and rising, so the trend is strong. -DI at 43.1 is far above +DI at 14.2, so bears are firmly in control. The ADX is high after a sharp drop, which can precede exhaustion, though no DI crossover is in sight. [Strong Trend – Bearish]
- Volume: 10.07M, with the heaviest recent bars on the red gap-down candles and a smaller green bounce bar at the end. Selling volume was heavy on the break and the bounce is on lighter volume, so the rebound is unconfirmed. Price at $690.56 is slightly below VWAP ($691.10). [Bearish bias, bounce unconfirmed]
DIVERGENCES & TRENDS
- There is no classic bullish divergence yet. The RSI low of 19.3 (Oct 30) is lower than the earlier ~25 RSI trough, and price is also lower, so both are making new lows together.
- RSI is turning up from an extreme while MACD and CMF are still falling. This points to a short-term oversold bounce inside a downtrend, not a trend reversal.
- A death-cross-style structure is forming in the short term: EMA 13 crossed below EMA 34 and price is below the SMA50 ($725.00).
- The SMA200 at $679.52 is the key long-term line and sits only about 1.6% below price. Price is still above it, so the long-term trend is intact.
- The gap-down from ~$715 to ~$694 on Oct 30 left an unfilled gap, and sellers dominated that session.
CHART PATTERNS
- Possible Bearish Flag / Pennant: After the sharp drop, a weak bounce into the $697–$699 area that stalls would match the bearish flag or pennant on the reference diagram. A break lower would target roughly the flagpole height (~$20–$25) below the breakdown, but that is beyond a 6-day horizon and would first have to break the SMA200.
- Bullish Falling Wedge (not confirmed): The decline has narrowed somewhat, and RSI is lifting. A close above the EMA 13 (~$699) would be needed to validate a reversal.
- Oversold bounce at the lower band and SMA200: This is not a diagram pattern, but it is the most relevant setup. The bounce zone is $681–$699.
POTENTIAL SCENARIOS
- Scenario 1: Bullish Oversold Relief Bounce — RSI is stretched near 30, price is bouncing off the lower Bollinger Band, and the SMA200 sits just below. A mean-reversion move toward the declining EMA 13 and gap area is likely. Trigger: hold above $685 and a close above $694 (VWAP area). Target: $697–$700 (EMA 13), with an extension to $708 (EMA 34) if the bounce is strong. Invalidation: a close below $681. (45% probability)
- Scenario 2: Bearish Trend Continuation — ADX 37.7 with -DI far above +DI, plus MACD and CMF deterioration, suggest sellers remain in control and the bounce fails below EMA 13. Trigger: rejection at $697–$700 or a break below $685. Target: $679.50 (SMA200), then $670–$675. Invalidation: a daily close above $700. (40% probability)
- Scenario 3: Neutral Consolidation — Price chops between the SMA200 area and the EMA 13 while indicators reset. Trigger: failure to break either $681 or $699. Target: $685–$697. Invalidation: a close outside that range. (15% probability)
PRICE TARGETS
- Target Price: $696.00 (6-day)
- Expected Range: $673.00 to $714.00 (width $41, about 5.9% of price, consistent with the 4–8% guide for 6 days)
- Key Levels: Support at $681.00 (lower Bollinger Band, with the SMA200 at $679.52 just below), Resistance at $699.09 (EMA 13)
OVERALL BIAS
OVERALL BIAS: BULLISH - A modest bounce is slightly more likely than continuation because RSI is oversold and turning up, and price is holding above the lower Bollinger Band and SMA200. The trend and money-flow indicators are bearish, though, so conviction is low. The upside is likely capped near the EMA 13 at about $699, and a loss of $681 would invalidate the call.
This is educational analysis and not financial advice.