QQQ 20-day bearish forecast — Nov 15, 2026
- Bias: Bearish
- Timeframe: 20 days (made Nov 15, 2026, target date Dec 4, 2026)
- Price at analysis: $679.89
- Price target: $668.00
- Expected range: $638.00 – $703.00
- Result: Pending — graded after the close on Dec 4, 2026
Get a free AI analysis of QQQ today
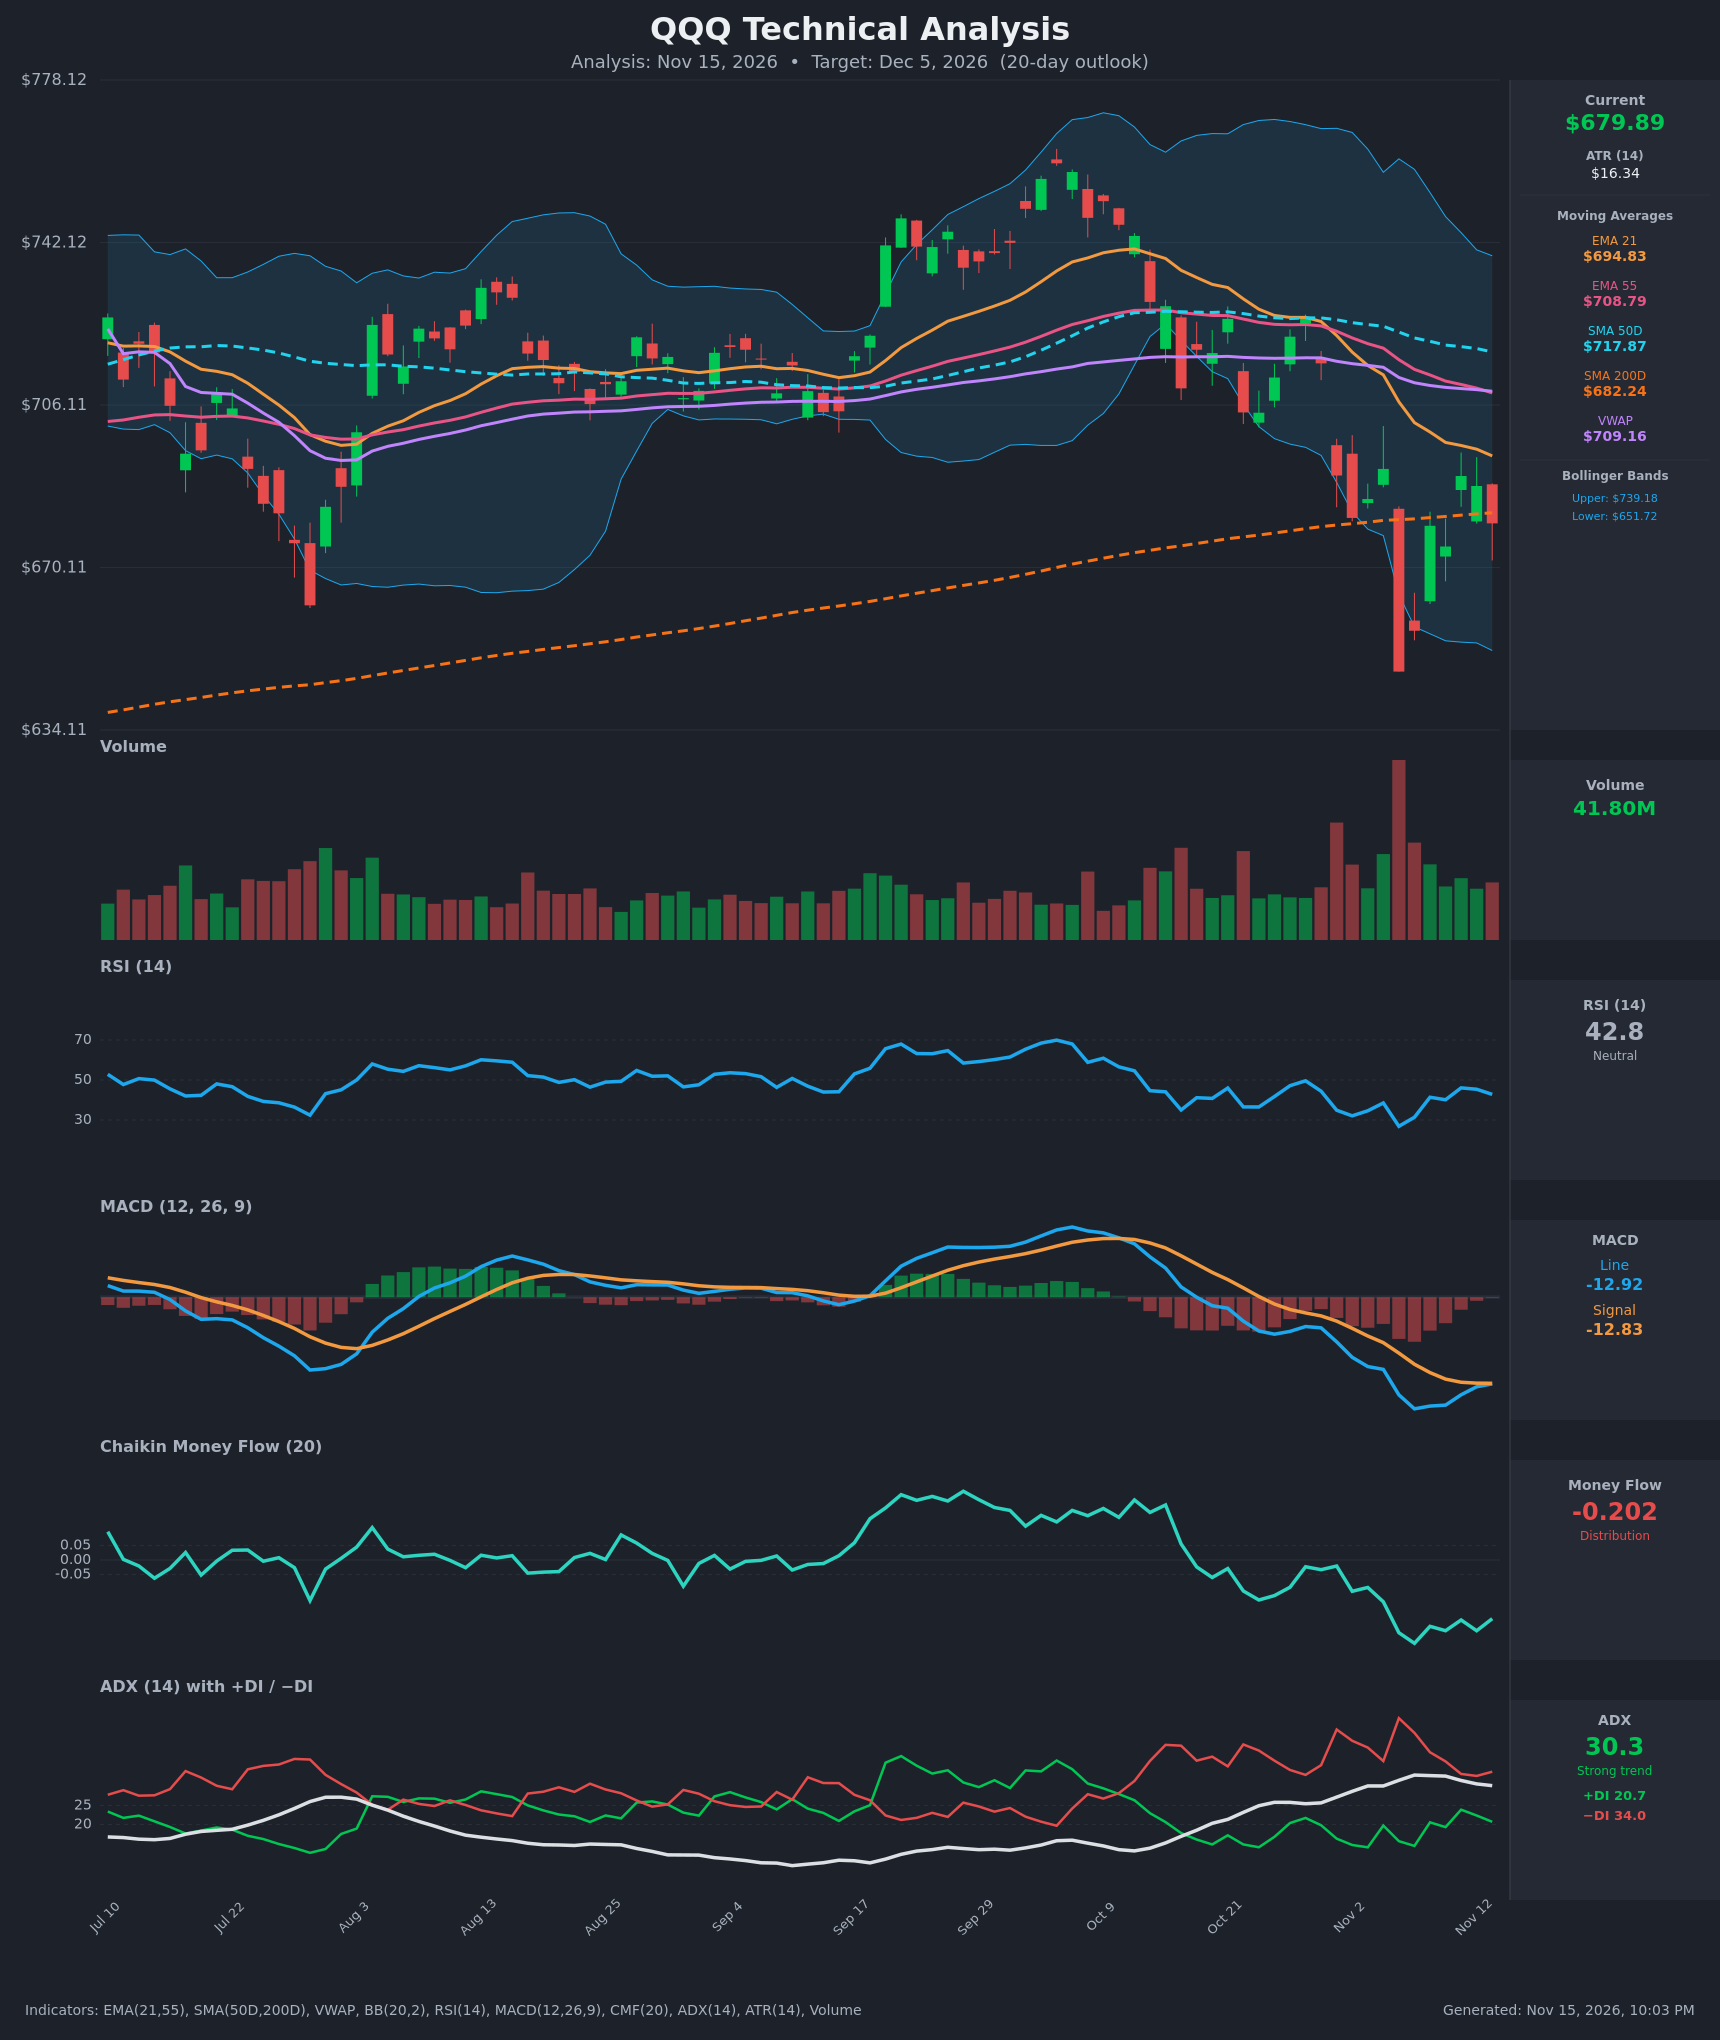
Analysis
TECHNICAL INDICATORS
- RSI (14): 42.81, below the 50 midline but well off the Nov 5 low of 26.9. It bounced to 46 and has now rolled over to 42.8. Momentum is soft with no oversold signal. [Bearish]
- 20 EMA: The 21 EMA is $694.83 and price at $679.89 is about 2.2% below it. The EMA is falling and has been rejecting rallies (Nov 11-12 failed under it). It is overhead resistance. [Bearish]
- MACD: Line -12.916, signal -12.830, histogram about -0.09. The line is converging on the signal after bottoming near -16.6, so a bullish cross is close. Both lines are deeply negative, and the line has just turned back down relative to the signal. [Bearish]
- Bollinger Bands (20): Upper $739.18, lower $651.72, midline about $695.45. Price sits in the lower half, below the midline. The bands are wide after the Nov 5 flush to $647 and are starting to contract. Price is not at the lower band, so there is no oversold snap-back signal. [Bearish]
- CMF (20): -0.202, well below -0.05, and it has been negative since mid-October. That is persistent, heavy distribution with no sign of recovery. [Distribution]
- ADX (14): 30.3 with -DI 34.0 over +DI 20.7. The trend is strong and bearish, though ADX has started to roll over from 33.1, so trend strength is peaking. [Strong Trend - Bearish]
- Volume: 41.80M, near average. The volume spike on the Nov 5 breakdown (-6.5%) was the highest in the window, which shows heavy selling. Rebound bars on Nov 9 and Nov 11 came on lighter volume, so buyers lack conviction. [Bearish]
DIVERGENCES & TRENDS
- Price vs. RSI: The Nov 5 low at $647 had RSI at 26.9. The recent retest near $675-680 shows RSI at 40-43. There is no clear bullish divergence, only a mild improvement from the washout.
- MACD: The line is flattening against the signal, which shows downside momentum fading. It is not a confirmed bullish cross.
- Moving averages: Price is below the EMA21 ($694.83), EMA55 ($708.79), SMA50D ($717.87) and VWAP ($709.16). The EMAs are stacked bearishly (21 < 55 < 50D). The SMA50D is falling toward the SMA200D, which could produce a death cross over coming weeks if weakness persists.
- SMA200D: Price is $679.89, just under the SMA200D at $682.24. QQQ has been oscillating around this rising long-term support line for several sessions, and the Nov 5 wick went well below it. A decisive close under it would be a notable breakdown.
- Trend: The index has fallen from about $750 in mid-October to $680, a roughly 9% decline. Lower highs ($725 to $692 to $690) show the downtrend is intact.
- DI: -DI has stayed above +DI since Oct 21 and the spread is wide at about 13 points.
CHART PATTERNS
- Bearish Rising Wedge / Head and Shoulders: Neither is clean. The large rally from Aug-Oct and the subsequent break lower resembles a rounded top that has turned into a Bearish Head and Shoulders roughly around Oct 9-21. The recent failure of rallies below the $690-695 zone acts as the right shoulder. The neckline is roughly the $680 area, which is already being tested.
- Possible Bearish Flag: The post-Nov 5 bounce to $690 is a weak, low-volume corrective rally. A breakdown would resume the decline toward $650 or lower, which is also the measured-move area.
- Double Bottom (bullish alternative): The Nov 5 low at $647 and the retest near $675 could form a base. It needs a close above about $692 to confirm, and it hasn't yet.
POTENTIAL SCENARIOS
- Scenario 1: Bearish Breakdown Below SMA200D — Price fails at the EMA21 and loses the SMA200D and Nov 10 low. -DI dominance, persistent CMF distribution and the bearish MA stack favor continuation. Trigger: daily close below $672. Target: $650-$655, with extension to $640 as a low. Invalidation: daily close above $695 (EMA21) on rising volume. (50% probability)
- Scenario 2: Neutral Chop Around SMA200D — The SMA200D holds, MACD crosses up slightly and QQQ ranges between $665 and $700 as the market digests the selloff. Trigger: holds $672 with RSI stabilizing above 40. Target: $680-$695. Invalidation: close outside $660-$705. (25% probability)
- Scenario 3: Bullish Relief Rally — A bounce from the SMA200D plus a bullish MACD cross leads to a push to the EMA55 and VWAP. Trigger: close above $695 (EMA21). Target: $708-$718. Invalidation: close back under $680. (25% probability)
PRICE TARGETS
For 20 days (to Dec 5, 2026), the expected range width should be about 8-12% of price, or roughly $54-$82. I use about $65 (9.6%).
- Target Price: $668.00 (about -1.7% from current, reflecting a modest bearish tilt with the SMA200D as a possible partial buffer)
- Expected Range: $638.00 to $703.00 (width $65, about 9.6%)
- Key Levels: Support at $647.00 (Nov 5 low), Resistance at $694.83 (EMA21)
OVERALL BIAS
OVERALL BIAS: BEARISH - Price is below all key moving averages except marginally the SMA200D, with -DI dominating at ADX 30, deeply negative CMF (-0.20) showing distribution, and rallies fading beneath the falling EMA21. The MACD is flattening and the SMA200D is nearby support, so I expect only a modest decline.
This is educational analysis and not financial advice.