QQQ 83-day bearish forecast — Nov 15, 2026
- Bias: Bearish
- Timeframe: 83 days (made Nov 15, 2026, target date Feb 5, 2027)
- Price at analysis: $679.89
- Price target: $660.00
- Expected range: $590.00 – $730.00
- Result: Pending — graded after the close on Feb 5, 2027
Get a free AI analysis of QQQ today
Analysis
TECHNICAL INDICATORS
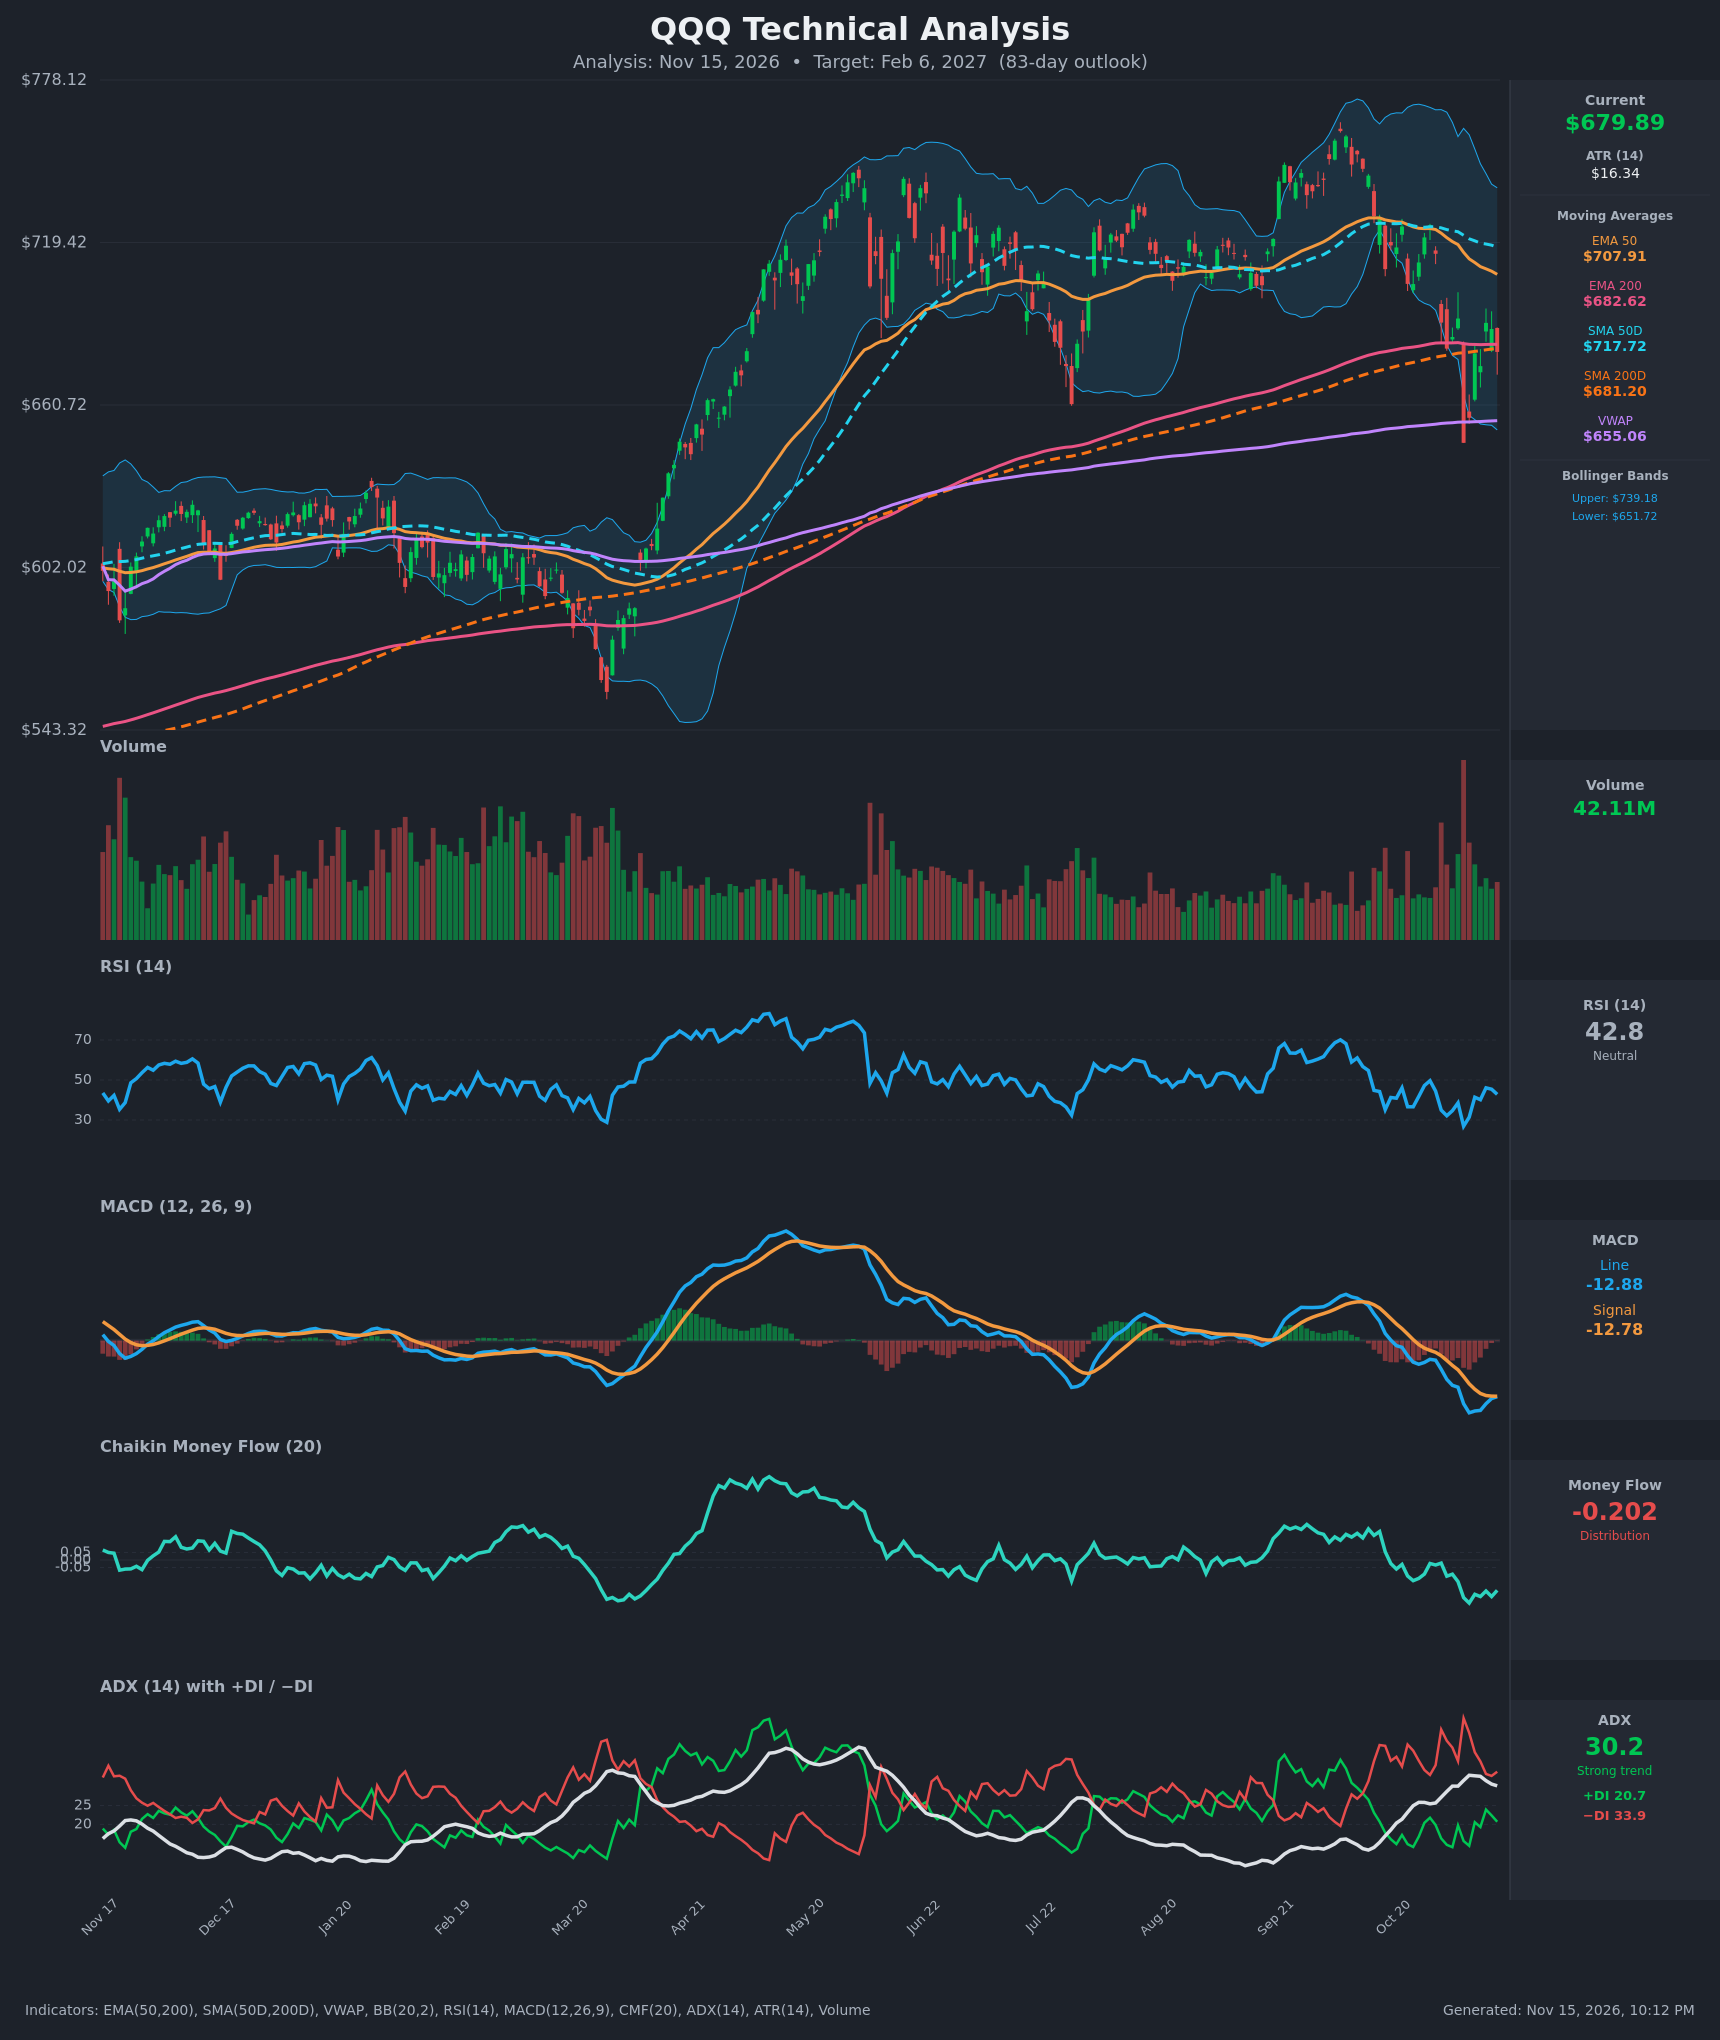
- RSI (14): 42.82, below the 50 midline and recovering from an oversold-edge low of 26.9 on Nov 5. It has bounced but keeps failing below 50 (peaked at 49.6 on Oct 28 and 46.1 on Nov 11). This is bear-market-style RSI behavior with a mild upward bounce. [Bearish]
- 20 EMA: Not provided. The EMA 50 at $707.91 is falling and about 4% above price, acting as overhead resistance. The 50-day SMA at $717.72 is also falling. [Bearish]
- MACD: Line -12.88 vs signal -12.78, so the line is just below the signal with a near-zero, slightly negative histogram. The line is deeply negative and the signal is still declining. It was nearly crossing back up on Nov 12, then rolled over again. [Bearish]
- Bollinger Bands (20): Upper $739.18, lower $651.72, with a midline near $695. Price at $679.89 sits in the lower half after the Nov 5 breach of the lower band. The bands are wide from the volatility spike, and price has not reclaimed the midline. [Bearish]
- CMF (20): -0.202, well below -0.05 and near the lows of the whole chart. It has been negative for weeks, showing persistent distribution and selling into rallies. [Distribution]
- ADX (14): 30.2 with −DI 33.9 above +DI 20.7. This is a strong trend with bears in control. ADX is easing slightly from 33.0 and +DI has been trying to recover, so the downtrend is losing some steam but has not reversed. [Strong Trend – Bearish]
- Volume: 42.11M, well below the huge capitulation spike on the Nov 5 drop. The volume on the bounce is modest, so the recovery lacks conviction. The spike also shows heavy supply near $647. [Bearish-leaning / Weak bounce]
Other levels:
- 200-day cluster: Price ($679.89) sits just under the EMA 200 ($682.62) and SMA 200 ($681.20). These two are now overhead resistance after a failed reclaim. [Bearish]
- VWAP: $655.06, below price and acting as support. [Neutral]
DIVERGENCES & TRENDS
- No clear bullish divergence: Price made a lower low on Nov 5 ($647) and RSI and MACD made lower lows with it. The RSI bounce to 46 failed under 50.
- Death-cross risk: The SMA 50 ($717.72) is still above the SMA 200 ($681.20), but the gap has narrowed from about $48 to about $37 and is shrinking quickly. The EMA 50 is converging on the EMA 200 in the same way.
- Money flow: CMF is making new lows while price bounces. This is a bearish divergence in money flow (price recovering, flow not confirming).
- Trend break: The ADX/DI flip to −DI dominance since late October confirms the shift from the September uptrend into a downtrend.
- MACD: The line is flattening against the signal, which is the one sign of momentum stabilizing. Confirmation needs a clean crossover and a close back above the 200-day MAs.
CHART PATTERNS
- Bearish Double Top / Head and Shoulders (loose): Price made highs in the $735–765 area through the summer and early autumn, then rolled over. Support at roughly $650–660 (the July low and Nov 5 low) is acting as a neckline. A decisive close below $647 would complete the reversal pattern. The measured move is large, but a partial move to about $600–620 is the realistic target over this window.
- Retest of the 200-day moving averages: Price is trying to reclaim the 200-day cluster (~$681–683) and failing. This is classic breakdown-retest behavior.
- Bullish counter-case: If price holds $647–655 and reclaims $718, the pattern becomes a failed breakdown or Bullish Double Bottom. This is not yet supported by the indicators.
POTENTIAL SCENARIOS
- Scenario 1: Bearish Breakdown Below the Neckline — Price keeps getting rejected at the 200-day cluster and the EMA 50, then breaks the Nov 5 low. A death cross and continued distribution (CMF negative) drive a further leg lower. Trigger: daily close below $647 (below the lower Bollinger Band and VWAP). Target: $620, then $600. Invalidation: daily close above $718 (SMA 50). (50% probability)
- Scenario 2: Bullish Reclaim and Recovery — The Nov 5 capitulation low holds, MACD crosses up, and price reclaims the 200-day MAs and then the EMA 50. Trigger: daily close above $708 with CMF turning positive. Target: $740 (upper Bollinger Band), possibly $760. Invalidation: close below $647. (30% probability)
- Scenario 3: Neutral Range — Price chops between $650 and $710 as the 200-day MAs flatten. Trigger: repeated failures at both $710 and $650 with ADX falling below 20. Target: $665–$700. Invalidation: close outside $645–$720. (20% probability)
PRICE TARGETS
- Target Price: $660.00 (83-day horizon)
- Expected Range: $590.00 to $730.00. The width is $140, about 20.6% of the current price, which fits the 61–180 day guidance of ~18–30%.
- Key Levels: Support at $647.00, Resistance at $707.91
OVERALL BIAS
OVERALL BIAS: BEARISH - Price is below the 200-day averages and the falling EMA 50 and SMA 50. −DI dominates with ADX at 30, CMF shows heavy distribution (-0.202), and MACD remains deeply negative. Bearish scenarios carry more weight, though the bounce off $647 and easing ADX keep conviction moderate.
This is educational analysis and not financial advice.