QQQ 48-day bearish forecast — Nov 15, 2026
- Bias: Bearish
- Timeframe: 48 days (made Nov 15, 2026, target date Jan 1, 2027)
- Price at analysis: $679.89
- Price target: $662.00
- Expected range: $610.00 – $710.00
- Result: Pending — graded after the close on Jan 1, 2027
Get a free AI analysis of QQQ today
Analysis
TECHNICAL INDICATORS
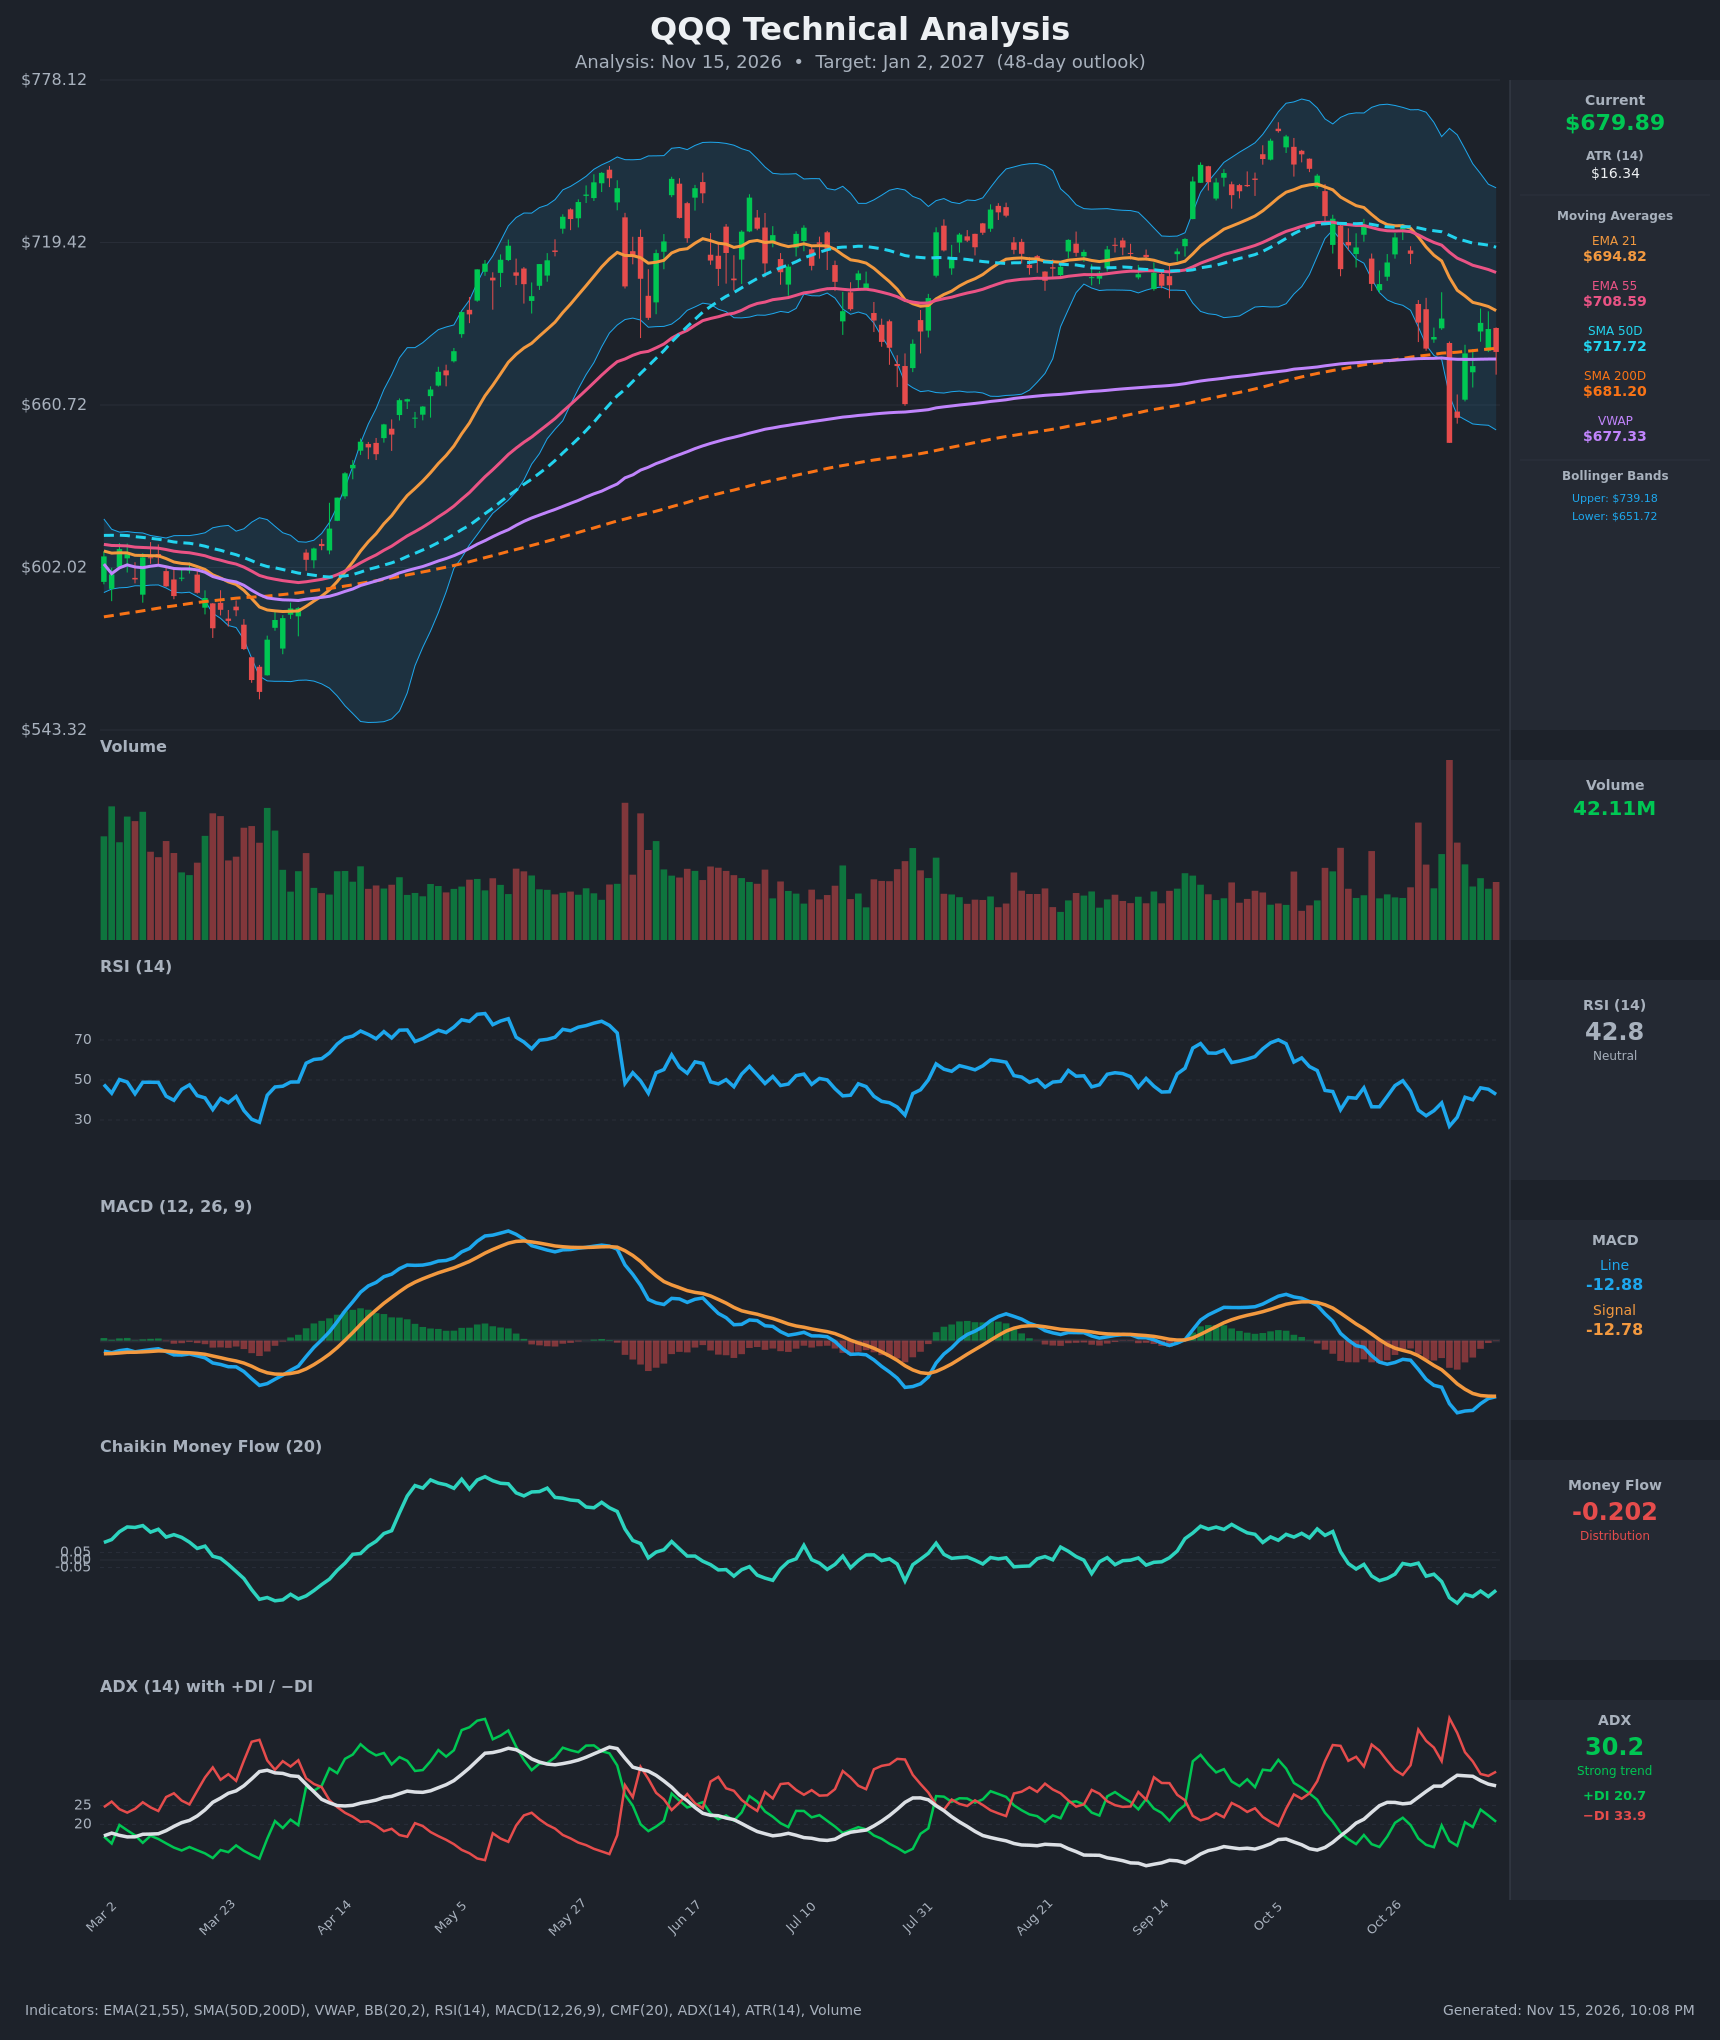
- RSI (14): 42.82, below the 50 midline and recovering from the 26.9 oversold low on Nov 5. It has bounced to the mid-40s but keeps failing under 50, so momentum is still soft with no bullish reversal yet. [Bearish]
- 20 EMA (EMA 21 = $694.82): Price at $679.89 is below the EMA 21 ($694.82), EMA 55 ($708.59) and SMA 50D ($717.72). The EMA 21 is sloping down and sits below the EMA 55, a bearish cross that occurred around Oct 30. These averages act as overhead resistance. [Bearish]
- MACD: Line -12.88 vs signal -12.78, with the line only just below the signal. The histogram is near zero (about -0.10) after contracting from its deep-negative Nov 6 level. The line is deeply negative and has not crossed up yet, so this is a base-building attempt rather than a confirmed buy. [Bearish]
- Bollinger Bands (20): Upper $739.18, lower $651.72, midline about $695.45. Price is in the lower half of the bands, about 31% of the way from the lower band. The bands are wide after the Nov 5 flush to $647 and the lower band has held, while price sits below the midline. [Bearish]
- CMF (20): -0.202, well below -0.05 and near the lows of the year. It has been negative for about two weeks (-0.02 to -0.29), which shows persistent distribution despite the bounce. [Distribution]
- ADX (14): 30.2 with −DI 33.9 above +DI 20.7. The trend is strong and bearish-led, though ADX is slipping from its 33.0 peak and the gap between −DI and +DI is narrowing, a sign of fading downside thrust. [Strong Trend – Bearish]
- Volume: 42.11M on the latest bar, with a large spike on the Nov 5 breakdown (the highest of the chart) and above-average volume on the sell-off bars. The bounce volume has been lighter and mixed. The Nov 5 spike reads like a capitulation or shakeout, but without follow-through buying. [Mixed / Capitulation-like]
- VWAP / SMA 200D: Price $679.89 is just above VWAP ($677.33) and just below SMA 200D ($681.20). Both are clustered right at price, making this a critical pivot zone for the long-term trend. [Neutral]
DIVERGENCES & TRENDS
- Price made a lower low on Nov 5 ($647.05), at RSI 26.9. RSI is now 42.8 with price at $679.89, so there is no clean divergence, but RSI and MACD did recover from their lows while price held above the Nov 5 low. That is a mild positive sign.
- MACD is flattening and converging on its signal line (the gap narrowed from -6 to -0.10). A bullish cross is possible soon, but it would occur far below zero and tends to be a weak signal in a downtrend.
- CMF is making new lows (-0.20) while price bounces. This is a bearish divergence suggesting the bounce lacks real buying behind it.
- A death cross is not confirmed. The SMA 50D ($717.72) is still above the SMA 200D ($681.20), but the gap is narrowing quickly (about $36) as the SMA 50D rolls over. EMA 21 below EMA 55 is already a bearish medium-term cross.
- Price has dropped from the October peak (~$760s) to the lower band, losing the EMA 21/55 and SMA 50D in the process. It is now pinned on the SMA 200D, which has been tested but not decisively lost.
- DI spread is narrowing (+DI up from 14.3 to 20.7), indicating selling pressure is moderating.
CHART PATTERNS
- Bearish Double Top / Head and Shoulders–type reversal: The structure of the chart shows a high in late September/October followed by a break below the Sep-Oct base (about $700-$710) and the EMAs. The lower highs after October reinforce a possible topping formation. The neckline-equivalent support near $680-$690 is being tested.
- Potential Bearish Flag / Rising Wedge on the bounce: The recovery from $647 to the $690 area is a corrective retracement under falling EMAs. If it rolls over, it resembles a bearish flag, with a measured move toward the lower band area and below ($640-$650).
- Support confluence: SMA 200D ($681.20), VWAP ($677.33) and the Nov 5 low ($647) form a layered floor. A hold here may lead to a sideways range ($650-$710), but the evidence is tilted to downside continuation on the slope of the averages and CMF.
- Overall the pattern is a bearish reversal in progress, with a range-bound relief attempt as the main alternative.
POTENTIAL SCENARIOS
- Scenario 1: Bearish Continuation Breakdown — Price fails at the EMA 21 ($695) / EMA 55 ($708) and rolls back under the SMA 200D, with CMF staying negative and −DI dominant. The Nov 5 low gets retested. Trigger: daily close below $670 / VWAP ($677). Target: $640-$655, with an extension to about $625 on the measured move. Invalidation: daily close above $710 (EMA 55 and above). (50% probability)
- Scenario 2: Bullish Relief Rally / Base Reclaim — Support at the SMA 200D and VWAP holds, MACD crosses up, and RSI moves back above 50, which pushes price toward the declining EMAs. Trigger: close above $695 (EMA 21) with improving volume. Target: $715-$725 (SMA 50D / EMA 55 zone). Invalidation: close below $650. (30% probability)
- Scenario 3: Neutral Choppy Range — Price oscillates between the SMA 200D area and the EMA 21, between about $655 and $705, while the indicators reset. Trigger: failure to break either $650 or $710. Target: $675-$690. Invalidation: close outside $645-$715. (20% probability)
PRICE TARGETS
For the 48-day timeframe (Jan 2, 2027), the range width should be ~12-18% of price.
- Target Price: $662.00
- Expected Range: $610.00 to $710.00 (width $100 = ~14.7% of current price, consistent with a 30-60 day horizon)
- Key Levels: Support at $647.00, Resistance at $694.82
OVERALL BIAS
OVERALL BIAS: BEARISH - Price is below the EMA 21/55 and SMA 50D, with −DI far above +DI at ADX 30, CMF at -0.20 showing persistent distribution, and a bearish EMA cross already in place. The SMA 200D/VWAP cluster at $677-$681 is the line in the sand, and a loss of it opens a retest of $647 or lower.
This is educational analysis and not financial advice.