QQQ 27-day bearish forecast — Nov 15, 2026
- Bias: Bearish
- Timeframe: 27 days (made Nov 15, 2026, target date Dec 11, 2026)
- Price at analysis: $679.89
- Price target: $669.00
- Expected range: $626.00 – $710.00
- Result: Pending — graded after the close on Dec 11, 2026
Get a free AI analysis of QQQ today
Analysis
TECHNICAL INDICATORS
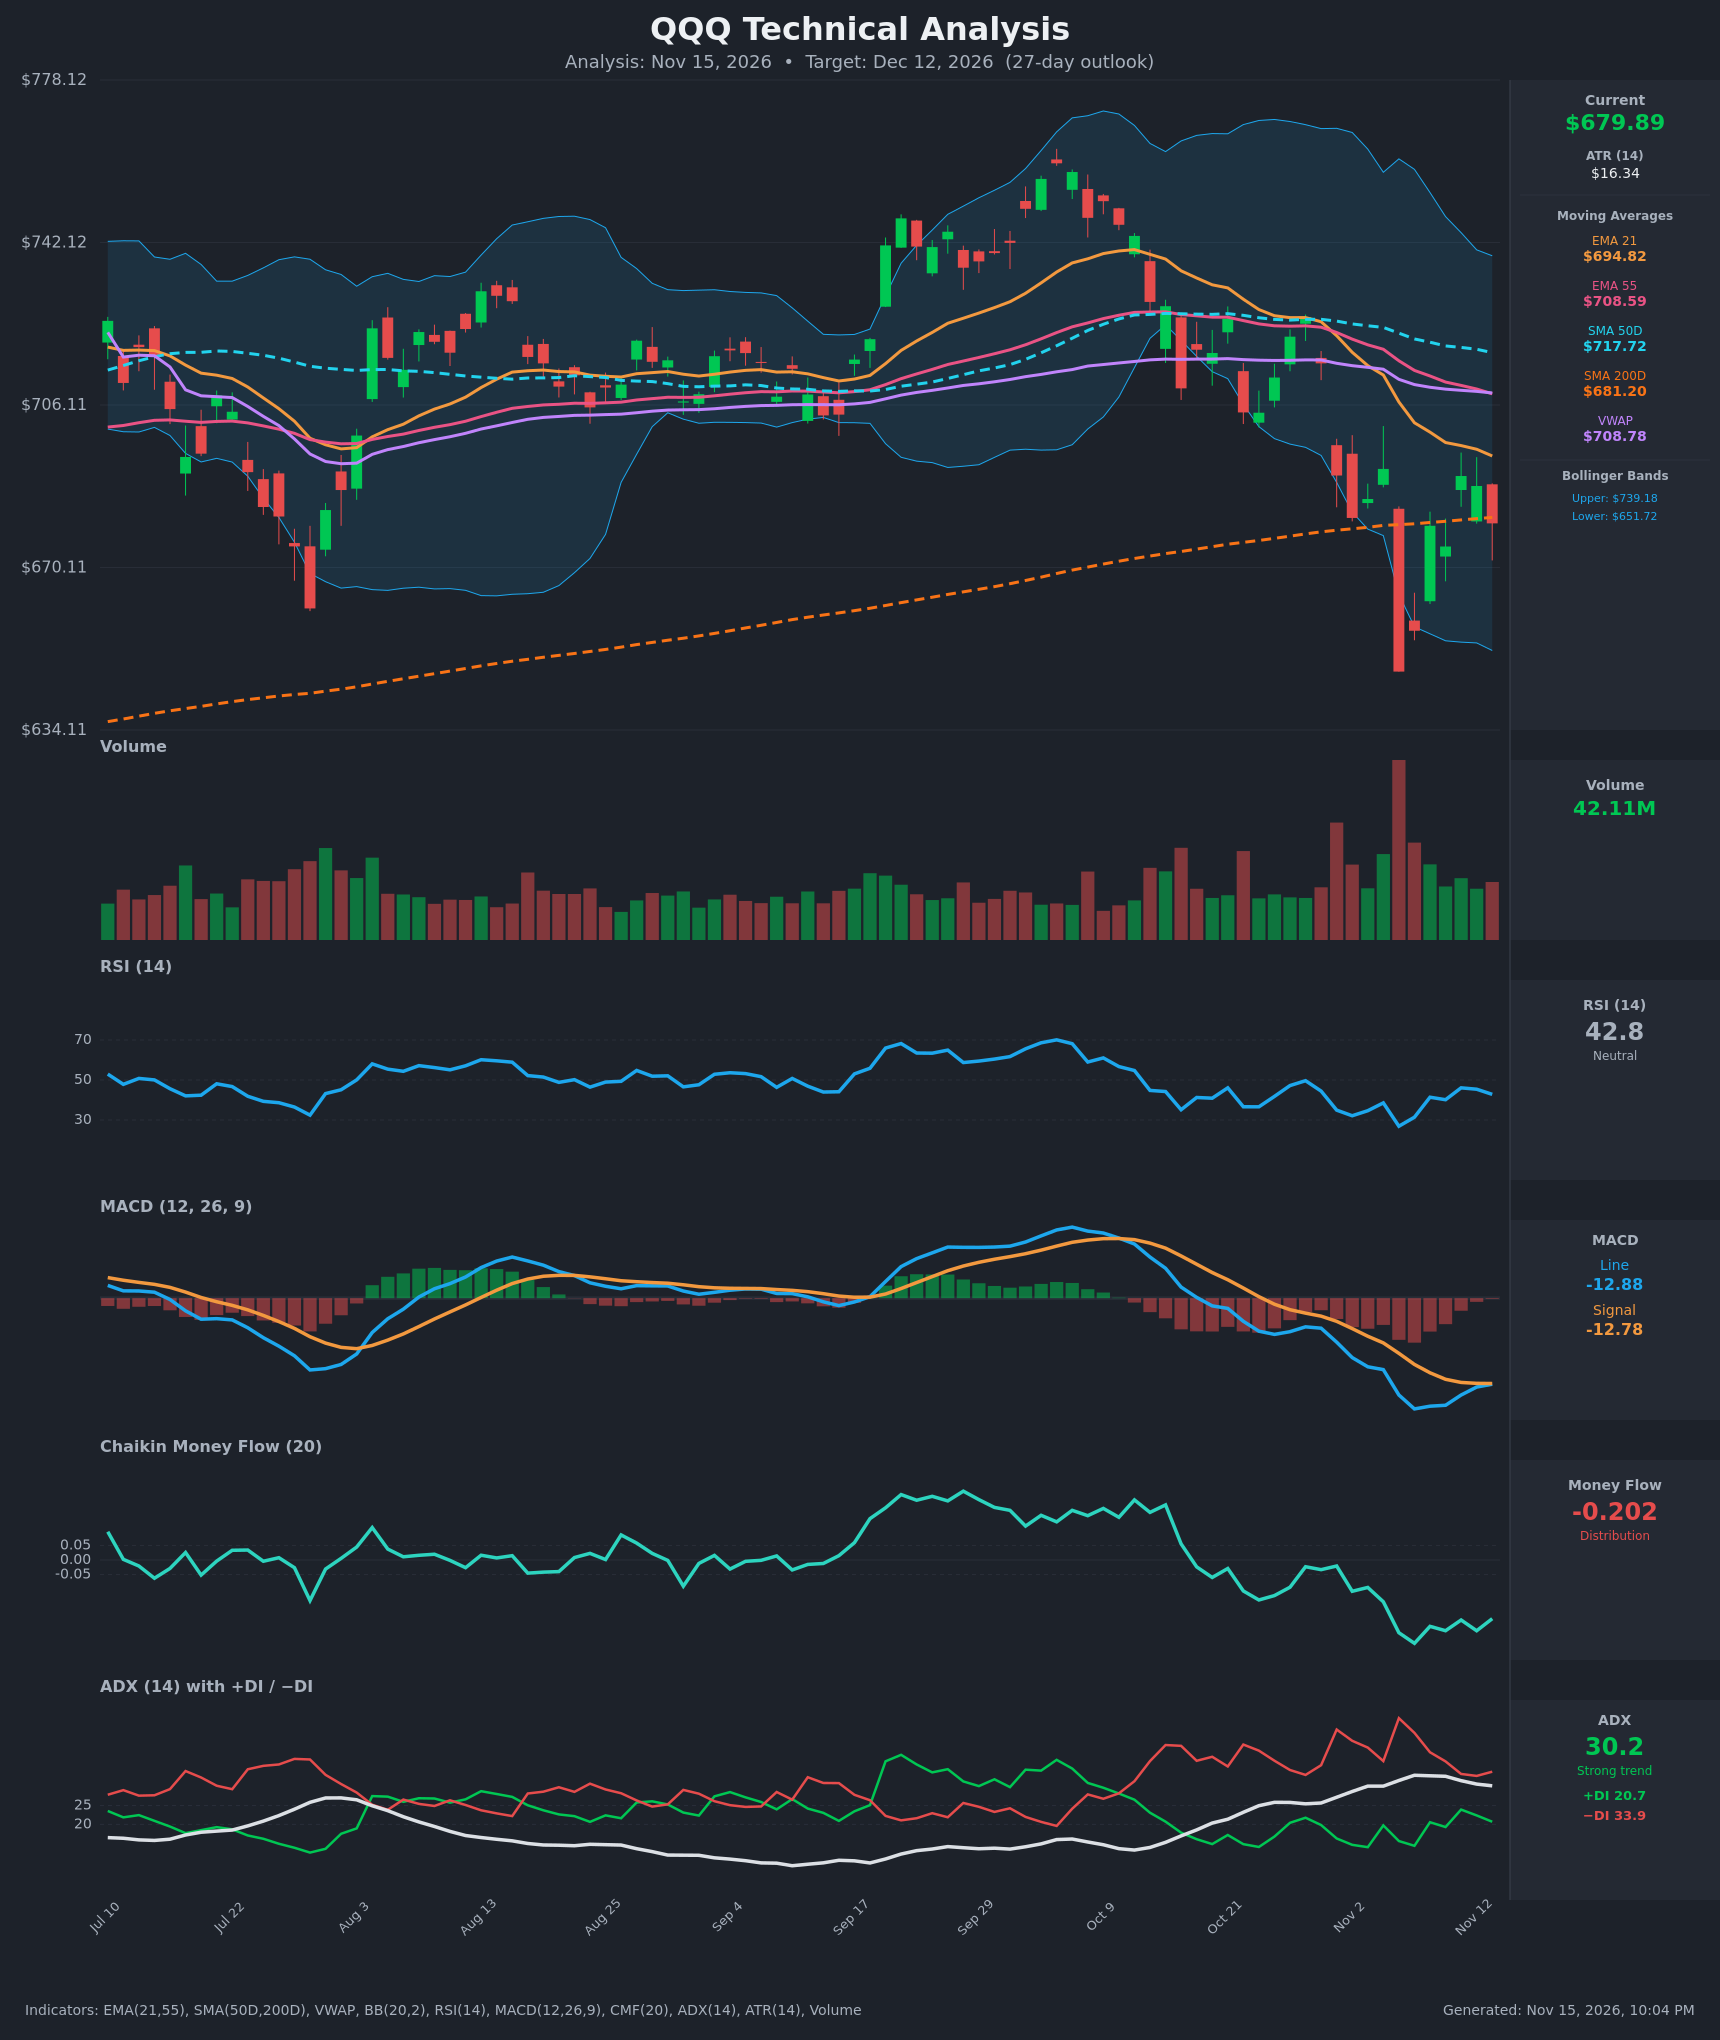
- RSI (14): 42.82, below the 50 midline but recovering from the oversold-adjacent 26.9 low on Nov 5. It has bounced and is now rolling over (46.1 → 42.8). Momentum is weak but not oversold. [Bearish]
- 20 EMA: The EMA 21 is at $694.82 and price ($679.89) is below it, so it acts as resistance. It is also below the EMA 55 ($708.59), which confirms a short-term downtrend. [Bearish]
- MACD: The line is at -12.88 and the signal at -12.78, so the line sits just under the signal. A bullish crossover nearly occurred, with the histogram narrowing toward zero, but the line is turning back down. Both lines are deeply negative. [Bearish]
- Bollinger Bands (20): The bands run from $651.72 to $739.18, with the midline near $695. Price is in the lower half, above the lower band, after the Nov 5 breakdown below it. The bands are wide, which shows elevated volatility. [Bearish]
- CMF (20): -0.202, well below -0.05, and it has been negative for the last 15 sessions. This is persistent distribution with no sign of improvement. [Distribution]
- ADX (14): 30.2, a strong trend, with −DI (33.9) well above +DI (20.7). ADX is rolling slightly lower from 33, but bears remain in control. [Strong Trend – Bearish]
- Volume: 42.11M, near average. The selloff days (Oct 30, Nov 5) came on heavy volume, and the bounces came on lighter volume. That is a distribution pattern. [Bearish]
DIVERGENCES & TRENDS
- Price made a lower low on Nov 5 ($647 close), while RSI (26.9) and MACD were both at extremes. The bounce has since faded, with lower highs in RSI.
- The MACD line is converging on the signal line but is now rolling over, so the bullish crossover has failed to complete.
- The EMA 21 is below the EMA 55, which is below the SMA 50D ($717.72). Price is below all three, and all are sloping down.
- Price sits just under the SMA200D ($681.20), at $679.89. The Nov 5 low pierced it, and price is now back below it. This is the key long-term support, and it is being lost.
- Price is also below VWAP ($708.78).
- CMF has dropped steadily from +0.1 in October to -0.2, which confirms the downtrend with no positive divergence.
- The SMA50D remains above the SMA200D, so there is no death cross yet. The gap is narrowing and a death cross is plausible later.
CHART PATTERNS
- Price formed a rounded top in late September/early October, then rolled into a series of lower highs ($725 → $712 → $692 → $690). This resembles a Bearish Head and Shoulders-style or Descending Triangle structure. The lower highs sit against horizontal support around $647–$680 (the SMA200D zone).
- A loss of the Nov 5 low (~$647) would confirm a breakdown, with a measured move toward the mid-$620s to $630s.
- The alternative is a Bullish Double Bottom at $647–$656 with a neckline near $692. This would need a close above $692–$695 (the EMA 21), and current evidence does not support it.
POTENTIAL SCENARIOS
- Scenario 1: Bearish Breakdown Continuation — Price fails at the EMA 21 and the SMA200D flips to resistance. Distribution (CMF -0.2) and −DI dominance drive a retest of the Nov 5 low. Trigger: daily close below $672 on rising volume. Target: $645–$655, with an extension to $630. Invalidation: daily close above $697. (50% probability)
- Scenario 2: Neutral Range-Bound Chop — Price oscillates between the Nov 5 low zone (~$650) and the EMA 21 (~$695) as the oversold bounce is digested. Trigger: holding $660 and failing at $695. Target: $665–$690. Invalidation: close outside $645–$700. (20% probability)
- Scenario 3: Bullish Double-Bottom Recovery — Price reclaims the SMA200D and EMA 21, and the MACD crossover completes. Trigger: close above $695 with volume. Target: $710–$718 (EMA 55 / SMA 50D). Invalidation: close below $660. (30% probability)
PRICE TARGETS
- Target Price: $669.00 (27-day)
- Expected Range: $626.00 to $710.00 (width $84, about 12.4% of the current price, which fits the 27-day guidance)
- Key Levels: Support at $647.05, Resistance at $694.82
OVERALL BIAS
OVERALL BIAS: BEARISH - Price is below the EMA 21, EMA 55, SMA 50D, SMA200D and VWAP. −DI is well above +DI with ADX at 30, and CMF at -0.20 shows persistent distribution. The MACD bullish crossover is failing, so a retest of the $647 low is more likely than a recovery.
This is educational analysis and not financial advice.