QQQ 62-day bearish forecast — Nov 15, 2026
- Bias: Bearish
- Timeframe: 62 days (made Nov 15, 2026, target date Jan 15, 2027)
- Price at analysis: $679.89
- Price target: $652.00
- Expected range: $590.00 – $725.00
- Result: Pending — graded after the close on Jan 15, 2027
Get a free AI analysis of QQQ today
Analysis
TECHNICAL INDICATORS
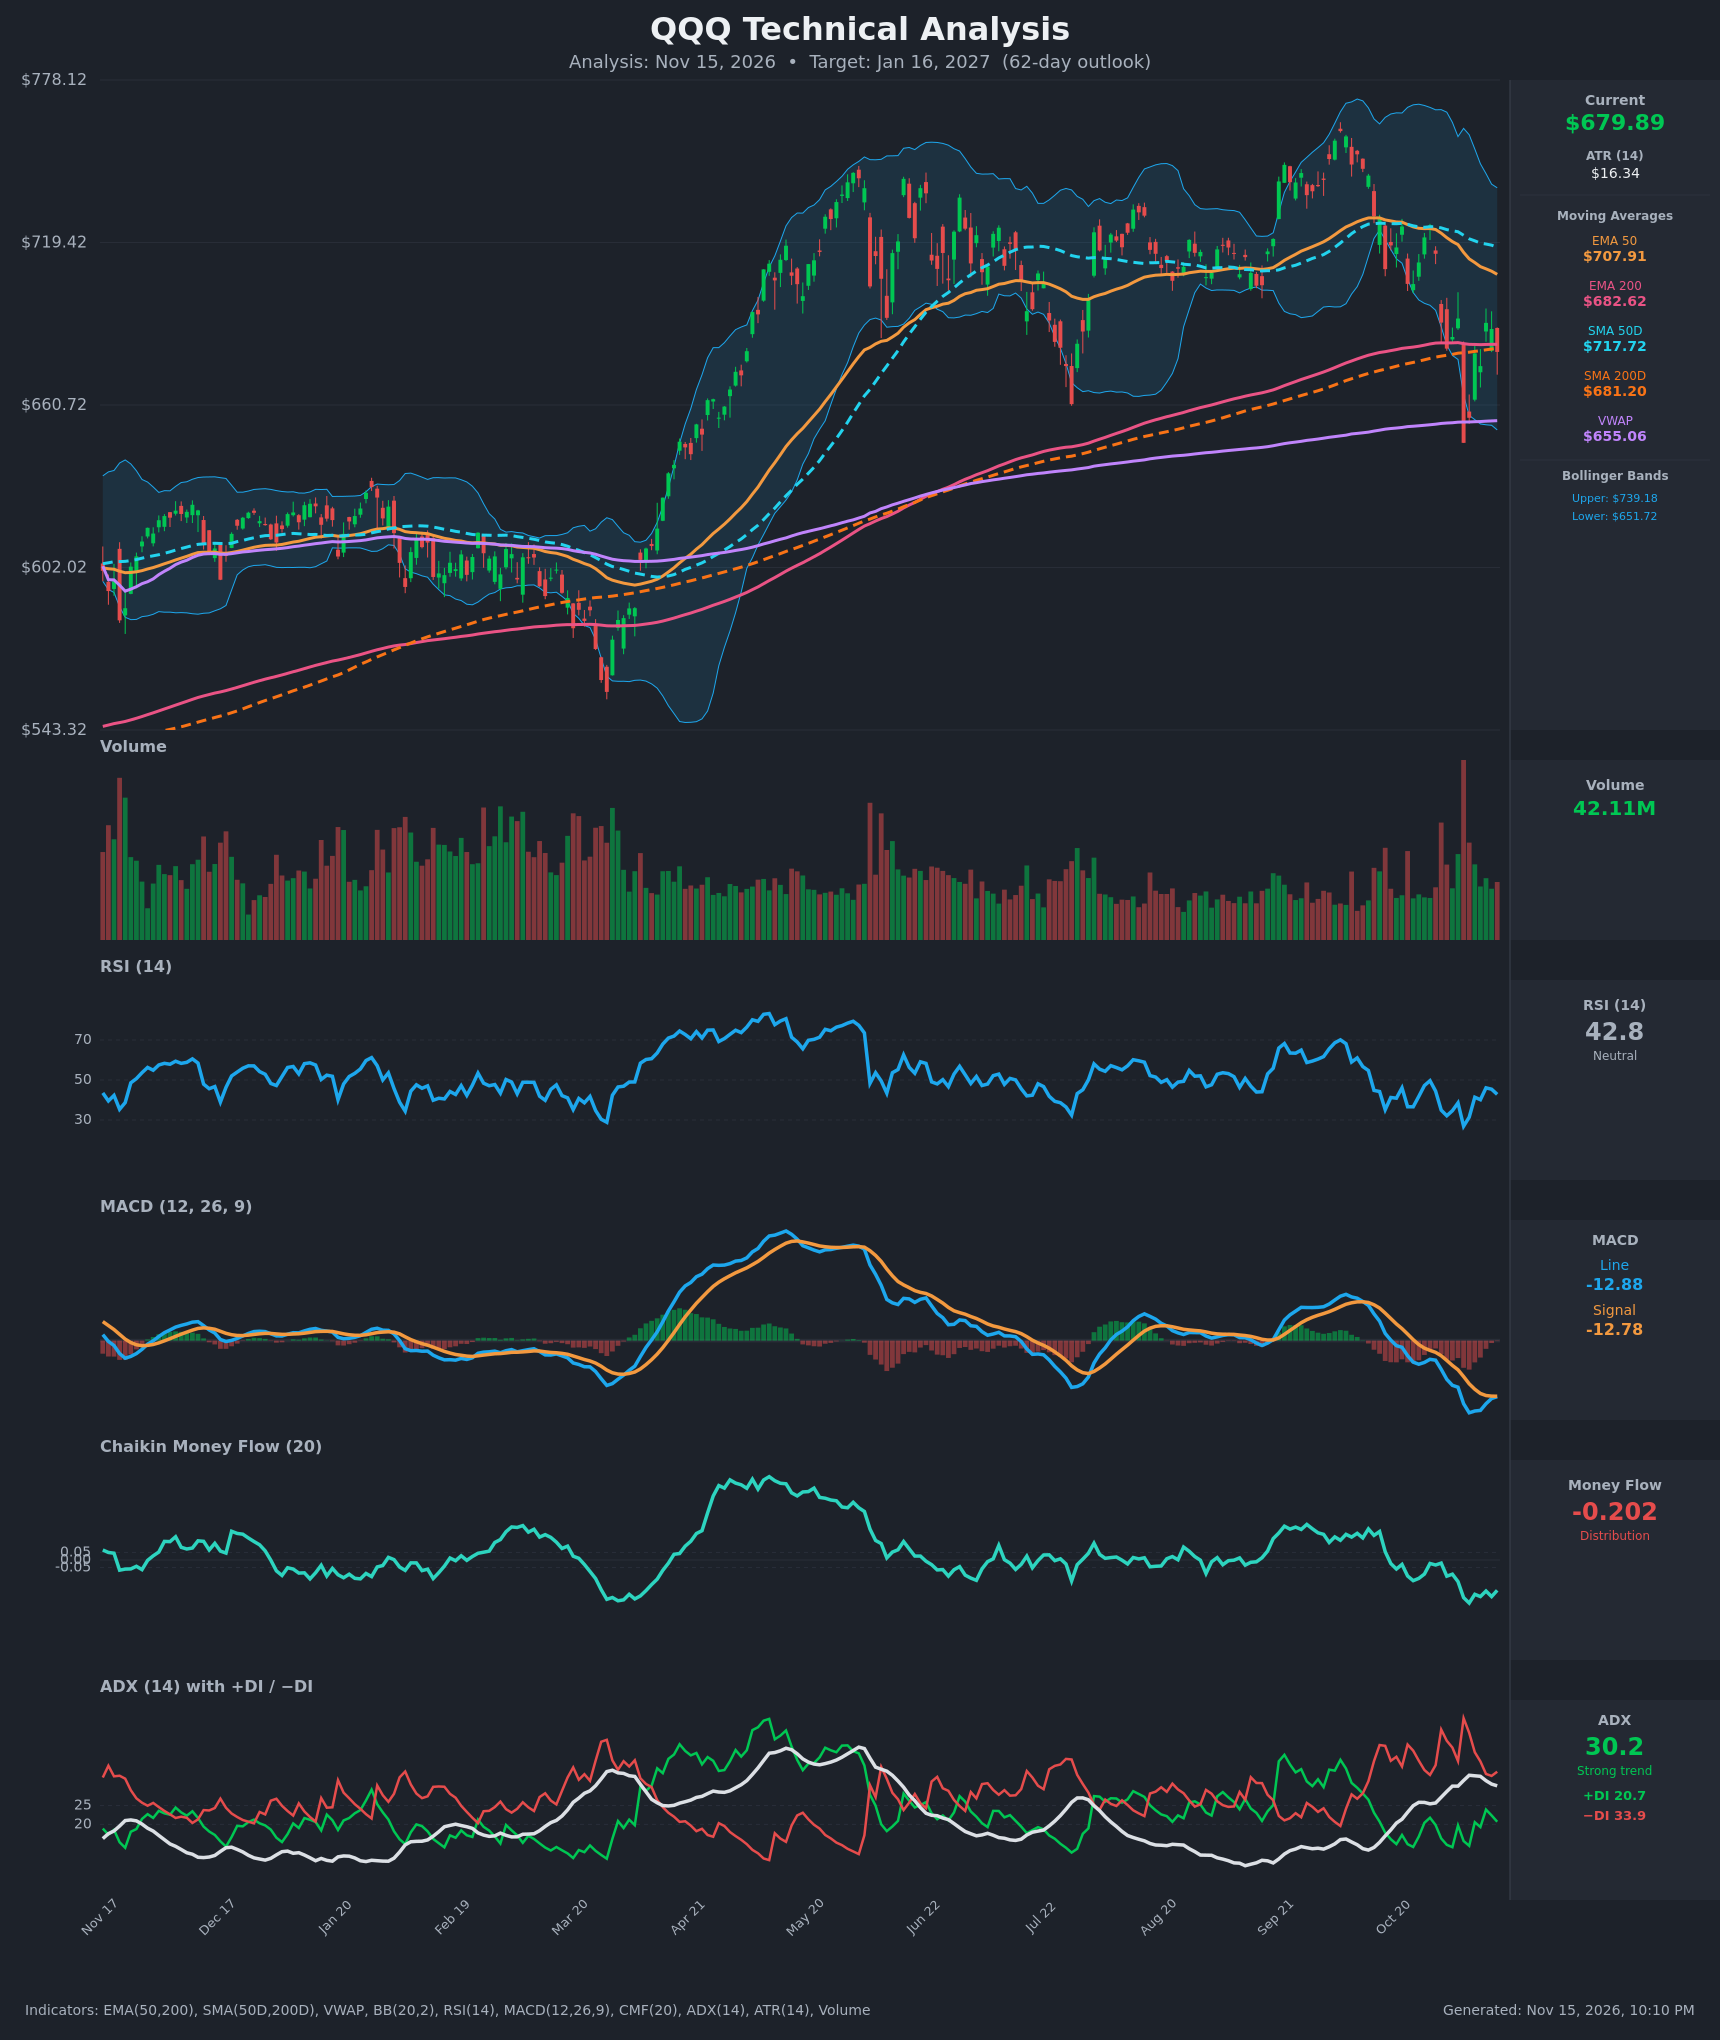
- RSI (14): 42.82, below the 50 midline and recovering from a 26.9 oversold low on Nov 5. The bounce stalled at 46 on Nov 11-12 and the reading is now turning down again. Momentum is soft with no bullish regime. [Bearish]
- 20 EMA: Not supplied. The Bollinger midline (20-period basis) is about $695, and price at $679.89 sits below it, so it acts as resistance. Price is also below the EMA 50 ($707.91) and SMA 50D ($717.72). [Bearish]
- MACD: Line -12.88 vs signal -12.78, histogram about -0.10. The line is still below the signal but has been rising from the -16.59 trough and is converging, so a marginal bullish cross is possible. Both lines are deep in negative territory, which reflects an established downtrend. [Bearish]
- Bollinger Bands (20): Upper $739.18, lower $651.72, midline about $695. Price is in the lower half of the bands, about 32% of the way up from the lower band. The bands are wide after the Nov 5 flush (close $647.05, below the lower band), and price has recovered toward the middle. [Bearish]
- CMF (20): -0.202, well below the -0.05 threshold and near its recent low. Distribution has been sustained since late October and no accumulation has appeared on the bounce. [Distribution]
- ADX (14): 30.2, a strong trend, easing from its 33.0 peak. -DI (33.9) is well above +DI (20.7), so bears control. +DI has been making lower highs (23.9 on Nov 11, then 20.7). [Strong Trend – Bearish]
- Volume: 42.11M. There was a large volume spike on the Nov 5 breakdown, which looks like a capitulation or distribution event. Volume has faded during the bounce, so the rebound lacks conviction. [Bearish-leaning / bounce on weak volume]
DIVERGENCES & TRENDS
- MACD/RSI: RSI made a higher low (26.9 on Nov 5 → 31.4 on Nov 6) and the MACD line is rising toward its signal. These are early signs of selling exhaustion, but price has not yet reclaimed key levels.
- Moving-average structure: Price is pinned right on the 200-day cluster (EMA 200 $682.62, SMA 200D $681.20), a decision zone. The EMA 50 ($707.91) and SMA 50D ($717.72) are falling steadily and converging toward the 200s. No death cross has occurred yet, but one is plausible within the 62-day window if weakness persists.
- ADX/DI: -DI has been above +DI for the whole 15-bar window, and ADX is above 25 and rising from the 20s. This is a confirmed bearish trend.
- CMF: The long decline from the positive readings in Sep to -0.20 shows persistent selling pressure. This is a negative trend in money flow.
- VWAP: Price at $679.89 is above VWAP ($655.06), a mild positive and the main bullish counterpoint. VWAP aligns with the lower Bollinger Band as a downside magnet.
- Highs: The Oct high was near the prior peak but failed to hold, and the series of lower highs since late Oct (725 → 715 → 691 → 690) points to a rolling top.
CHART PATTERNS
- Bearish Double Top (reversal): The May-June highs and the Sep-Oct highs form two peaks in the mid-$740s to $760s. The neckline is around the July low (~$660). The Nov 5 close at $647.05 broke below this neckline. The partial recovery back above $660 could be a neckline retest. A measured move (peak ≈ $760 minus neckline ≈ $660 = ~$100) projects toward the $560-$580 area. That is an extreme target and would need a failed hold of the 200-day cluster.
- Possible bear trap: The sharp rebound above the neckline and above the 200-day cluster is a risk to the pattern. A reclaim of $708+ (EMA 50) with CMF turning positive would invalidate it.
- Rising-wedge/bearish flag character: The bounce from $647 is a small corrective rally under falling 50-period averages, consistent with a bearish continuation flag if it rolls over below $695-$708.
POTENTIAL SCENARIOS
- Scenario 1: Bearish Double-Top Continuation — The bounce fades beneath the 200-day cluster and the falling EMA 50, and sellers push price through the Nov 5 low. A possible death cross forms as the 50s fall toward the 200s. Trigger: daily close below $670, then below $647. Target: $640-$650, with an extension toward $600-$620. Invalidation: daily close above $708 with CMF back above 0. (50% probability)
- Scenario 2: Bullish Reclaim and Relief Rally — The MACD bullish cross and the RSI higher low lead to a reclaim of the 200-day cluster, and price rallies into the falling averages. Trigger: close above $683 and then $695 (BB midline) on rising volume. Target: $708-$718 (EMA 50/SMA 50D), with a stretch to $739 (upper BB). Invalidation: close back below $670. (30% probability)
- Scenario 3: Neutral Range Chop — Price oscillates between the lower band/VWAP area (~$650-$655) and the EMA 50 (~$708) as ADX fades. Trigger: ADX drops below 25 and CMF returns toward 0. Target: $670-$695. Invalidation: close outside $647-$708. (20% probability)
PRICE TARGETS
- Target Price: $652.00 (62-day target, about 4.1% below the current price, near the lower Bollinger Band and VWAP)
- Expected Range: $590.00 to $725.00 (width $135, about 19.9% of current price, in line with 62-day guidance)
- Key Levels: Support at $647.05 (Nov 5 low / lower BB area), Resistance at $707.91 (EMA 50; the 200-day cluster at ~$681-$683 is the first hurdle)
OVERALL BIAS
OVERALL BIAS: BEARISH - ADX at 30 with -DI far above +DI, CMF at -0.20 (distribution), price below the falling EMA 50 and SMA 50D and sitting on the 200-day cluster, and a probable double-top neckline break all favor lower prices. Conviction is moderate because RSI and MACD show early stabilization and price is above VWAP.
This is educational analysis and not financial advice.