QQQ 4-day bearish forecast — Nov 1, 2026
- Bias: Bearish
- Timeframe: 4 days (made Nov 1, 2026, target date Nov 4, 2026)
- Price at analysis: $690.56
- Price target: $686.00
- Expected range: $673.00 – $701.00
- Result: Correct (+0.1%) — closed at $691.18 on Nov 4, 2026; quality score 100/100
Get a free AI analysis of QQQ today
Analysis
TECHNICAL INDICATORS
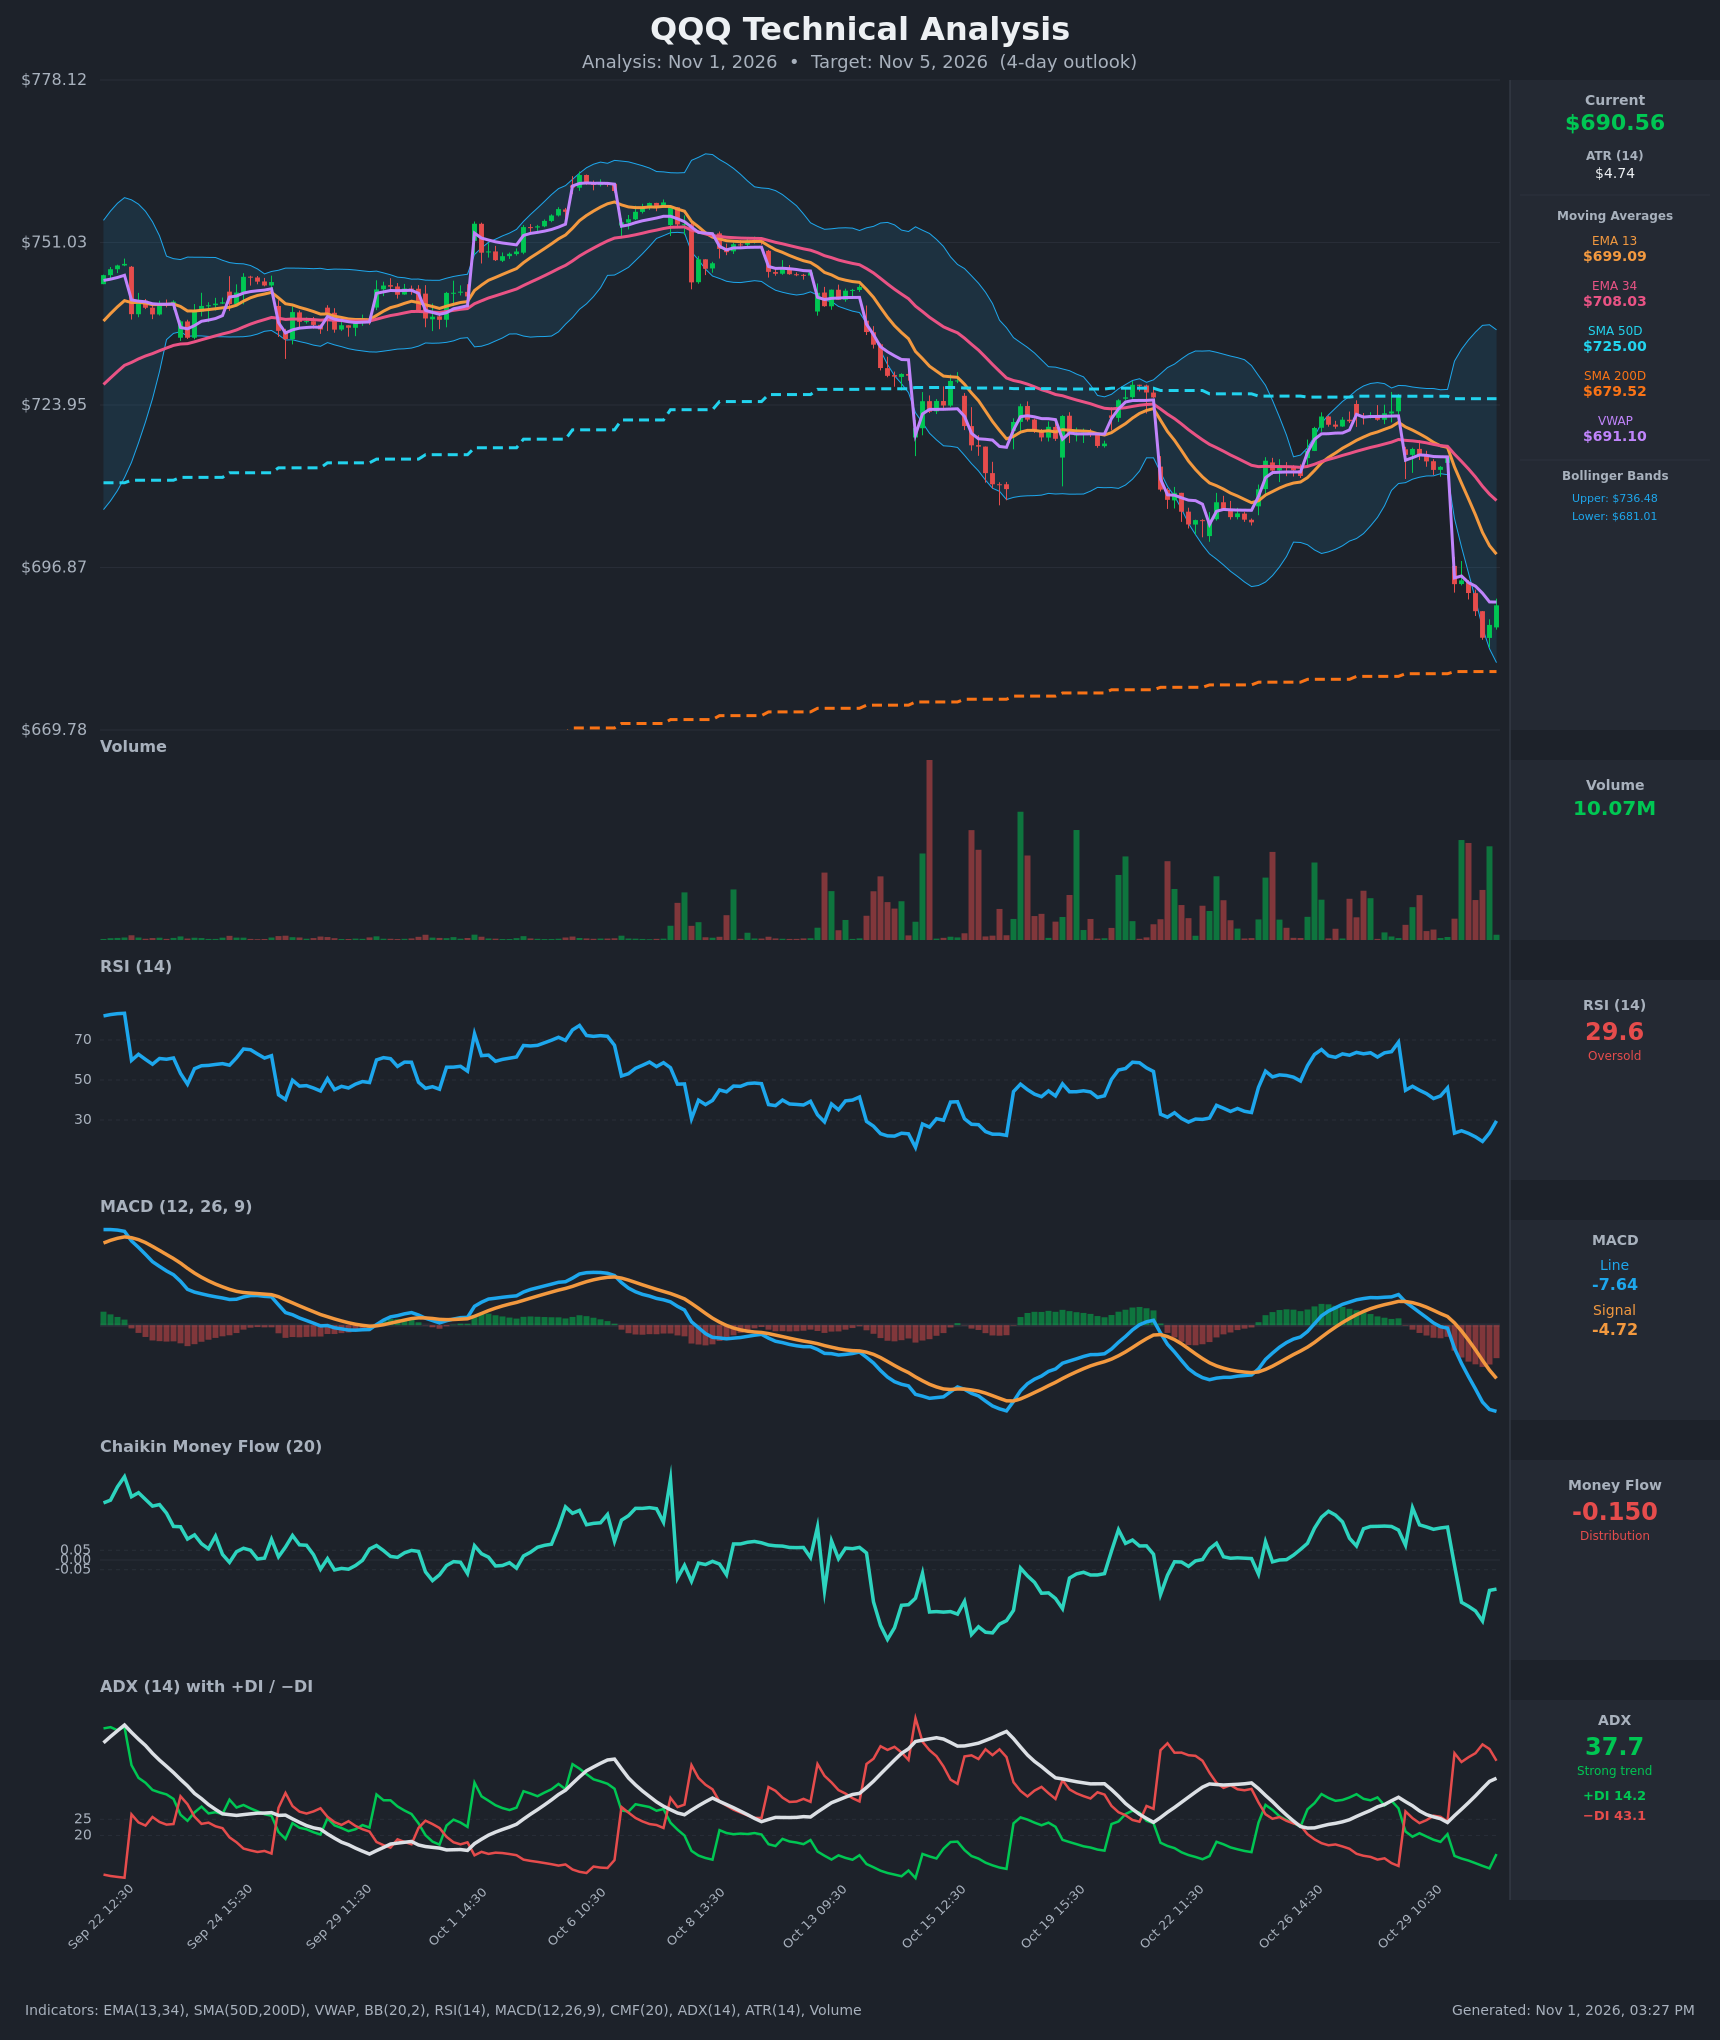
- RSI (14): 29.56, just back above the 30 line after a low of 19.3 at Oct 30 13:30. It is oversold but ticking up (19.3 → 23.5 → 29.6). The bounce is early and has not yet crossed back above 30 with conviction. [Neutral]
- 20 EMA: The supplied EMAs are 13 and 34. EMA13 is $699.09 and EMA34 is $708.03, and price at $690.56 is below both. EMA13 has been below EMA34 since Oct 29 14:30 and the gap is widening, so overhead averages are acting as resistance. [Bearish]
- MACD: Line -7.64 is below signal -4.72, with a widening negative histogram. The bearish crossover happened around Oct 29 14:30, and the line is still accelerating down. [Bearish]
- Bollinger Bands (20): Price at $690.56 sits in the lower half of the bands (lower $681.01, upper $736.48). The bands are very wide after the gap-down, and price pierced the lower band during the sell-off before recovering. This points to a possible short-term relief bounce, but there is no squeeze or reversal confirmation. [Neutral]
- CMF (20): -0.150, well below -0.05 and down from +0.17 on Oct 29. Selling pressure has increased sharply, though it ticked up slightly from -0.315. [Distribution]
- ADX (14): 37.7 and rising, with −DI 43.1 far above +DI 14.2. This is a strong downtrend with bears firmly in control. +DI is only slightly up from its low. [Strong Trend – Bearish]
- Volume: 10.07M on the latest bar, which is lower than the heavy red-volume bars during the Oct 30 drop. Selling volume was heavy on the breakdown, and the latest green bounce has lighter volume, so buyers are not yet showing conviction. VWAP at $691.10 is just above price, which makes it immediate resistance. [Bearish-leaning]
DIVERGENCES & TRENDS
- There is no bullish RSI/price divergence yet. RSI made a low of 19.3 on the Oct 30 13:30 bar, which was also the price low ($685.16). RSI is now recovering faster than price, which is an early mean-reversion signal.
- The trend is clearly down. Price made a lower high on Oct 28 (~$725) and then gapped down ~3% on Oct 30. Price is now below EMA13, EMA34 and SMA50D ($725.00).
- The EMA13/EMA34 bearish cross is confirmed.
- The MACD bearish cross is confirmed and still deepening.
- The −DI dominance is confirmed, with ADX rising from 24 to 37.7.
- Price remains above SMA200D ($679.52), which is the last major long-term support, about 1.6% below. SMA50D is above SMA200D, so there is no death cross, but SMA50D has been flat.
- The CMF turn from positive to deeply negative confirms the distribution behind the gap.
CHART PATTERNS
- Bearish continuation structure (bear flag / pennant): After the sharp gap-down leg ($715 → $685), the small corrective bounce to $690.56 could develop into a bear flag. A break below ~$685 would measure toward roughly $670–$675.
- Possible Bullish Falling Wedge (lower confidence): The sequence of lower highs and lower lows from Oct 28 is wide and fast, not converging, so this is not yet a valid wedge. An oversold bounce only matters if price reclaims VWAP/EMA13 (~$691–$699).
- Gap-down: The ~$694 gap area and the $713–$715 zone are overhead resistance. Gaps like this are typically only partially filled in the short term.
POTENTIAL SCENARIOS
- Scenario 1: Bearish Trend Continuation / Test of SMA200D — The strong downtrend (ADX 37.7, −DI dominance, negative CMF, widening MACD) continues. Price fails at VWAP/$695 and drifts toward the 200-day. Trigger: rejection at $691–$695 or a break below $685.16. Target: $679.50–$682, with an extension to ~$675. Invalidation: close above $699 (EMA13). (45% probability)
- Scenario 2: Bullish Oversold Relief Bounce — RSI is recovering from 19 and price is near the lower Bollinger Band and above the 200-day. A short-covering rally fills part of the gap. Trigger: reclaim of VWAP ($691.10) and a push above $695. Target: $699 (EMA13) and up to ~$703. Invalidation: break below $681 (lower band). (40% probability)
- Scenario 3: Neutral Consolidation — Price pins between the 200-day support and VWAP/EMA13 resistance. Trigger: ADX flattens and price trades $682–$696 for 4 days. Target: ~$690. Invalidation: close outside $680–$699. (15% probability)
PRICE TARGETS
- Target Price: $686.00 (4-day horizon, slight downside lean as the trend outweighs the oversold bounce)
- Expected Range: $673.00 to $701.00 (width $28 ≈ 4.1% of current price, appropriate for a 4-day window)
- Key Levels: Support at $679.52 (SMA200D; lower Bollinger Band at $681.01 just above it), Resistance at $699.09 (EMA13, with VWAP at $691.10 as first hurdle)
OVERALL BIAS
OVERALL BIAS: BEARISH - Most indicators agree on the downside: price is below EMA13, EMA34 and SMA50D, MACD is below signal with a widening histogram, CMF shows distribution, and ADX at 37.7 with −DI at 43.1 marks a strong downtrend. The oversold RSI near the 200-day SMA ($679.52) makes a bounce likely, so downside is probably limited to a test of that support rather than a collapse.
This is educational analysis and not financial advice.