TQQQ 6-day bullish forecast — Nov 1, 2026
- Bias: Bullish
- Timeframe: 6 days (made Nov 1, 2026, target date Nov 6, 2026)
- Price at analysis: $62.02
- Price target: $63.40
- Expected range: $60.20 – $64.90
- Result: Incorrect (-15.4%) — closed at $52.49 on Nov 6, 2026; quality score 0/100
Get a free AI analysis of TQQQ today
Analysis
TECHNICAL INDICATORS
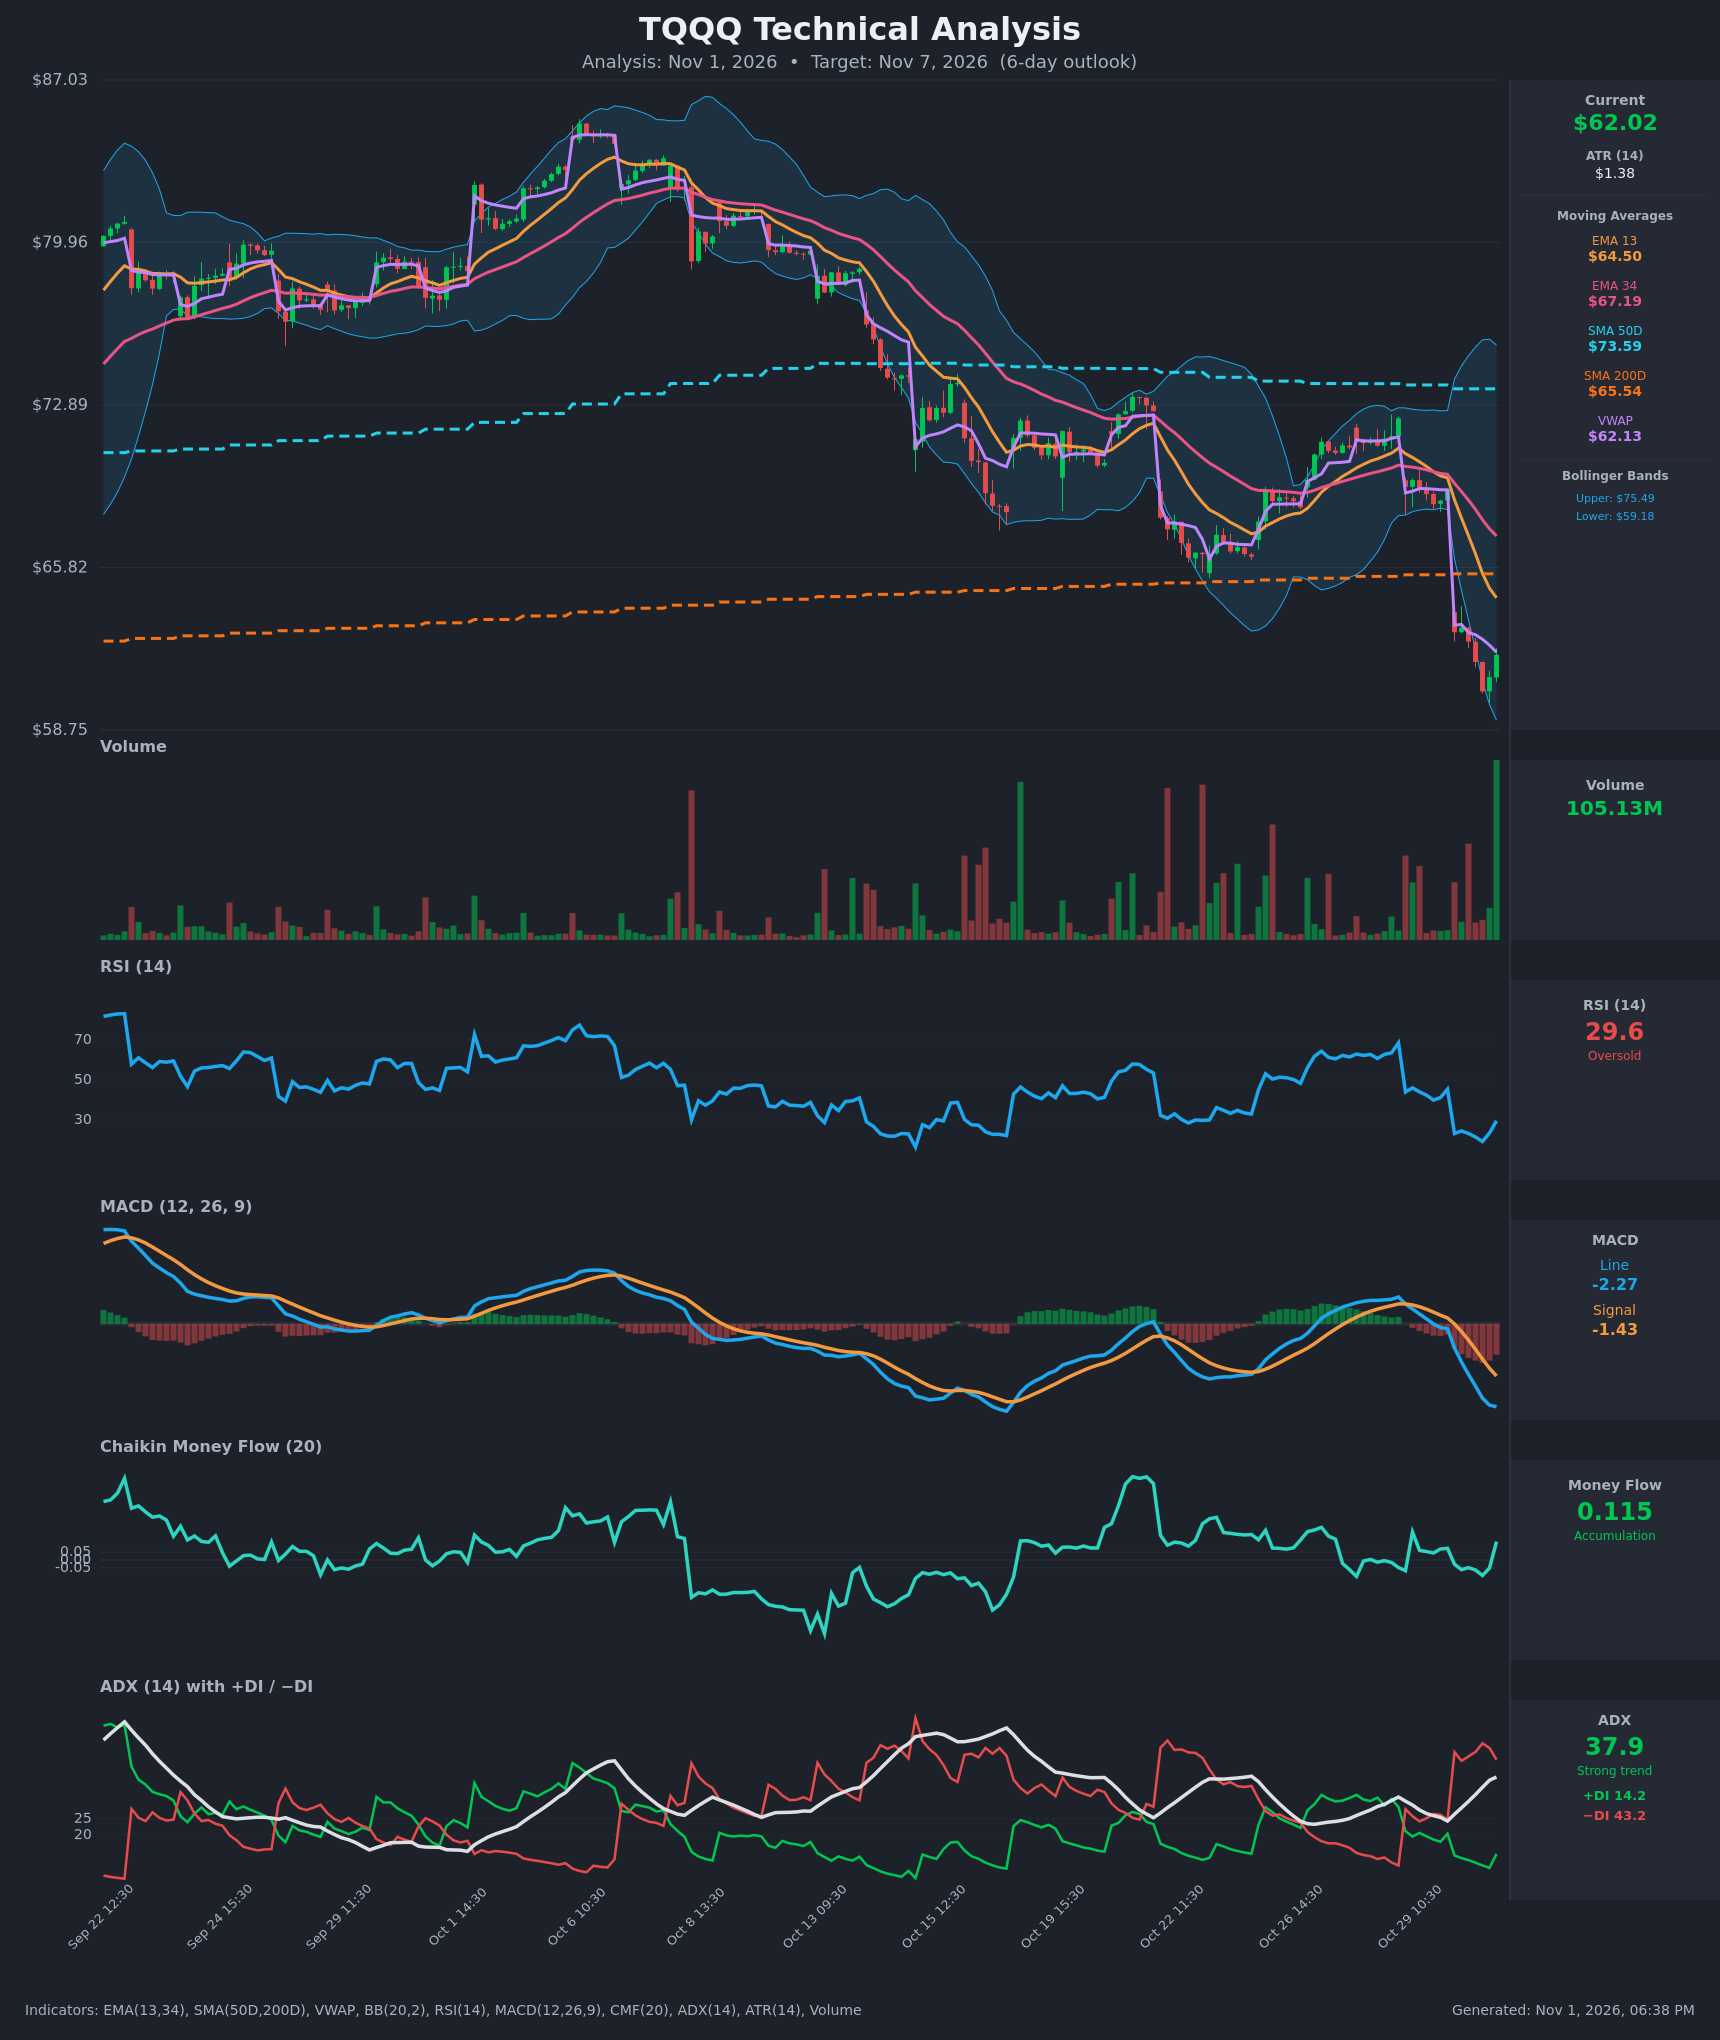
- RSI (14): 29.56, up from a low of 19.3 two hours earlier. It is just back above the oversold line and turning higher, but still deep in bearish territory. [Neutral]
- 20 EMA: The data gives EMA 13 at $64.50 and EMA 34 at $67.19, with EMA 13 below EMA 34 (a bearish crossover on Oct 29). Price at $62.02 is below both, so they act as overhead resistance. EMA 13 is the first bounce target. [Bearish]
- MACD: Line -2.27 is below signal -1.43 (bearish cross on Oct 29-30), and the histogram is negative and widening. The line is flattening slightly (-2.229 to -2.274), so downside momentum is still intact but the rate of decline is easing. [Bearish]
- Bollinger Bands (20): Upper $75.49, lower $59.18. Price at $62.02 sits in the lower quarter of the bands, after a recent push to or through the lower band, and the bands are wide. This is stretched to the downside, which favors a relief bounce but is not a reversal signal by itself. [Neutral]
- CMF (20): +0.115, up from -0.097 at the lows, and above the +0.05 threshold. Buying pressure appeared on the last bar, which is an early sign of dip-buying. [Accumulation]
- ADX (14): 37.9 and rising, with -DI at 43.2 far above +DI at 14.2. This is a strong, bearish-controlled trend. An extreme DI spread and a steep drop often mark a late-stage move prone to snap-back rallies. [Strong Trend – Bearish]
- Volume: 105.13M on the latest bar, the largest of the whole chart, on a green candle. That points to capitulation or heavy dip-buying near $59-60, though a single bar needs follow-through. [Potential capitulation / bullish reversal volume]
DIVERGENCES & TRENDS
- There is no clean bullish RSI divergence. RSI made a low of 19.3 as price made its low of about $60.43 on the hourly closes. The bounce is more of a momentum reset than a divergence.
- CMF has flipped positive (-0.097 to +0.115) while price is at its lows. This is a mild bullish divergence in money flow.
- The trend is strongly down. Price made a lower high at about $72 on Oct 28 and then gapped from $69.22 to $63.01 on Oct 30.
- Price has broken below SMA200 ($65.54), a key long-term support that now becomes resistance. SMA50 ($73.59) is still above SMA200, so there is no death cross, but the gap is narrowing.
- Price is below VWAP ($62.13) by a hair, so it is almost at VWAP after the bounce.
- MACD and the DI lines are bearish. EMA 13 is below EMA 34. All of these confirm the downtrend.
CHART PATTERNS
- Bearish Expanding Triangle / broadening structure: The wide swings from Oct 22 to Oct 29 followed by a breakdown loosely resemble this pattern. Its bearish projection has largely been delivered by the gap-down.
- Bullish Falling Wedge / Double Bottom (early, unconfirmed): The $59-60 low printed on huge volume could become the first leg of a double bottom or a falling-wedge exit. Neither is confirmed yet. A move back above $64.50 (EMA 13) would be needed.
- Gap-down and SMA200 break: This is a bearish continuation setup. A rally into $64.50-65.50 would likely be a retest of broken support (a bearish retest) rather than a trend change.
- The most useful reading is an oversold bounce inside a larger downtrend. The first targets are the gap-fill zone at $63-64.5 and EMA 13 at $64.50.
POTENTIAL SCENARIOS
- Scenario 1: Bullish Oversold Relief Bounce — RSI is back above 30, CMF is positive, and the high-volume green bar suggests capitulation. Price mean-reverts toward EMA 13 and the lower end of the gap. Trigger: hold above $60.50 and close above $63.00. Target: $63.50-$64.50 (EMA 13), with a stretch to $65.50 (SMA200). Invalidation: close below $59.50. (50% probability)
- Scenario 2: Bearish Trend Continuation — The strong ADX and -DI dominance continue, the bounce stalls at VWAP or $63, and sellers push through the lower Bollinger Band. Trigger: rejection at $63-64.50 or a break below $60.00. Target: $57.50-$59.00. Invalidation: daily close above $65.50. (35% probability)
- Scenario 3: Neutral Basing Range — Price chops between $60 and $64 as volatility cools after the gap. Trigger: failure to clear $64.50 and failure to break $60. Target: $61-$63. Invalidation: a break outside $59.50 or $65.00. (15% probability)
PRICE TARGETS
- Target Price: $63.40 (6-day, modest mean-reversion bounce toward EMA 13)
- Expected Range: $60.20 to $64.90. Width is $4.70, about 7.6% of the current price, which fits the 6-day guidance.
- Key Levels: Support at $59.18 (lower Bollinger Band, near the recent low), Resistance at $64.50 (EMA 13, with SMA200 at $65.54 just above)
OVERALL BIAS
OVERALL BIAS: BULLISH - The trend is bearish, but price is oversold at the lower Bollinger Band, and the record-volume green bar and the CMF flip to positive favor a relief bounce toward $63-64.50. Conviction is modest, since the bounce faces heavy resistance at EMA 13 and SMA200 and a close below $59.50 would negate it.
This is educational analysis and not financial advice.