TQQQ 48-day bearish forecast — Nov 15, 2026
- Bias: Bearish
- Timeframe: 48 days (made Nov 15, 2026, target date Jan 1, 2027)
- Price at analysis: $57.68
- Price target: $53.50
- Expected range: $44.00 – $63.00
- Result: Pending — graded after the close on Jan 1, 2027
Get a free AI analysis of TQQQ today
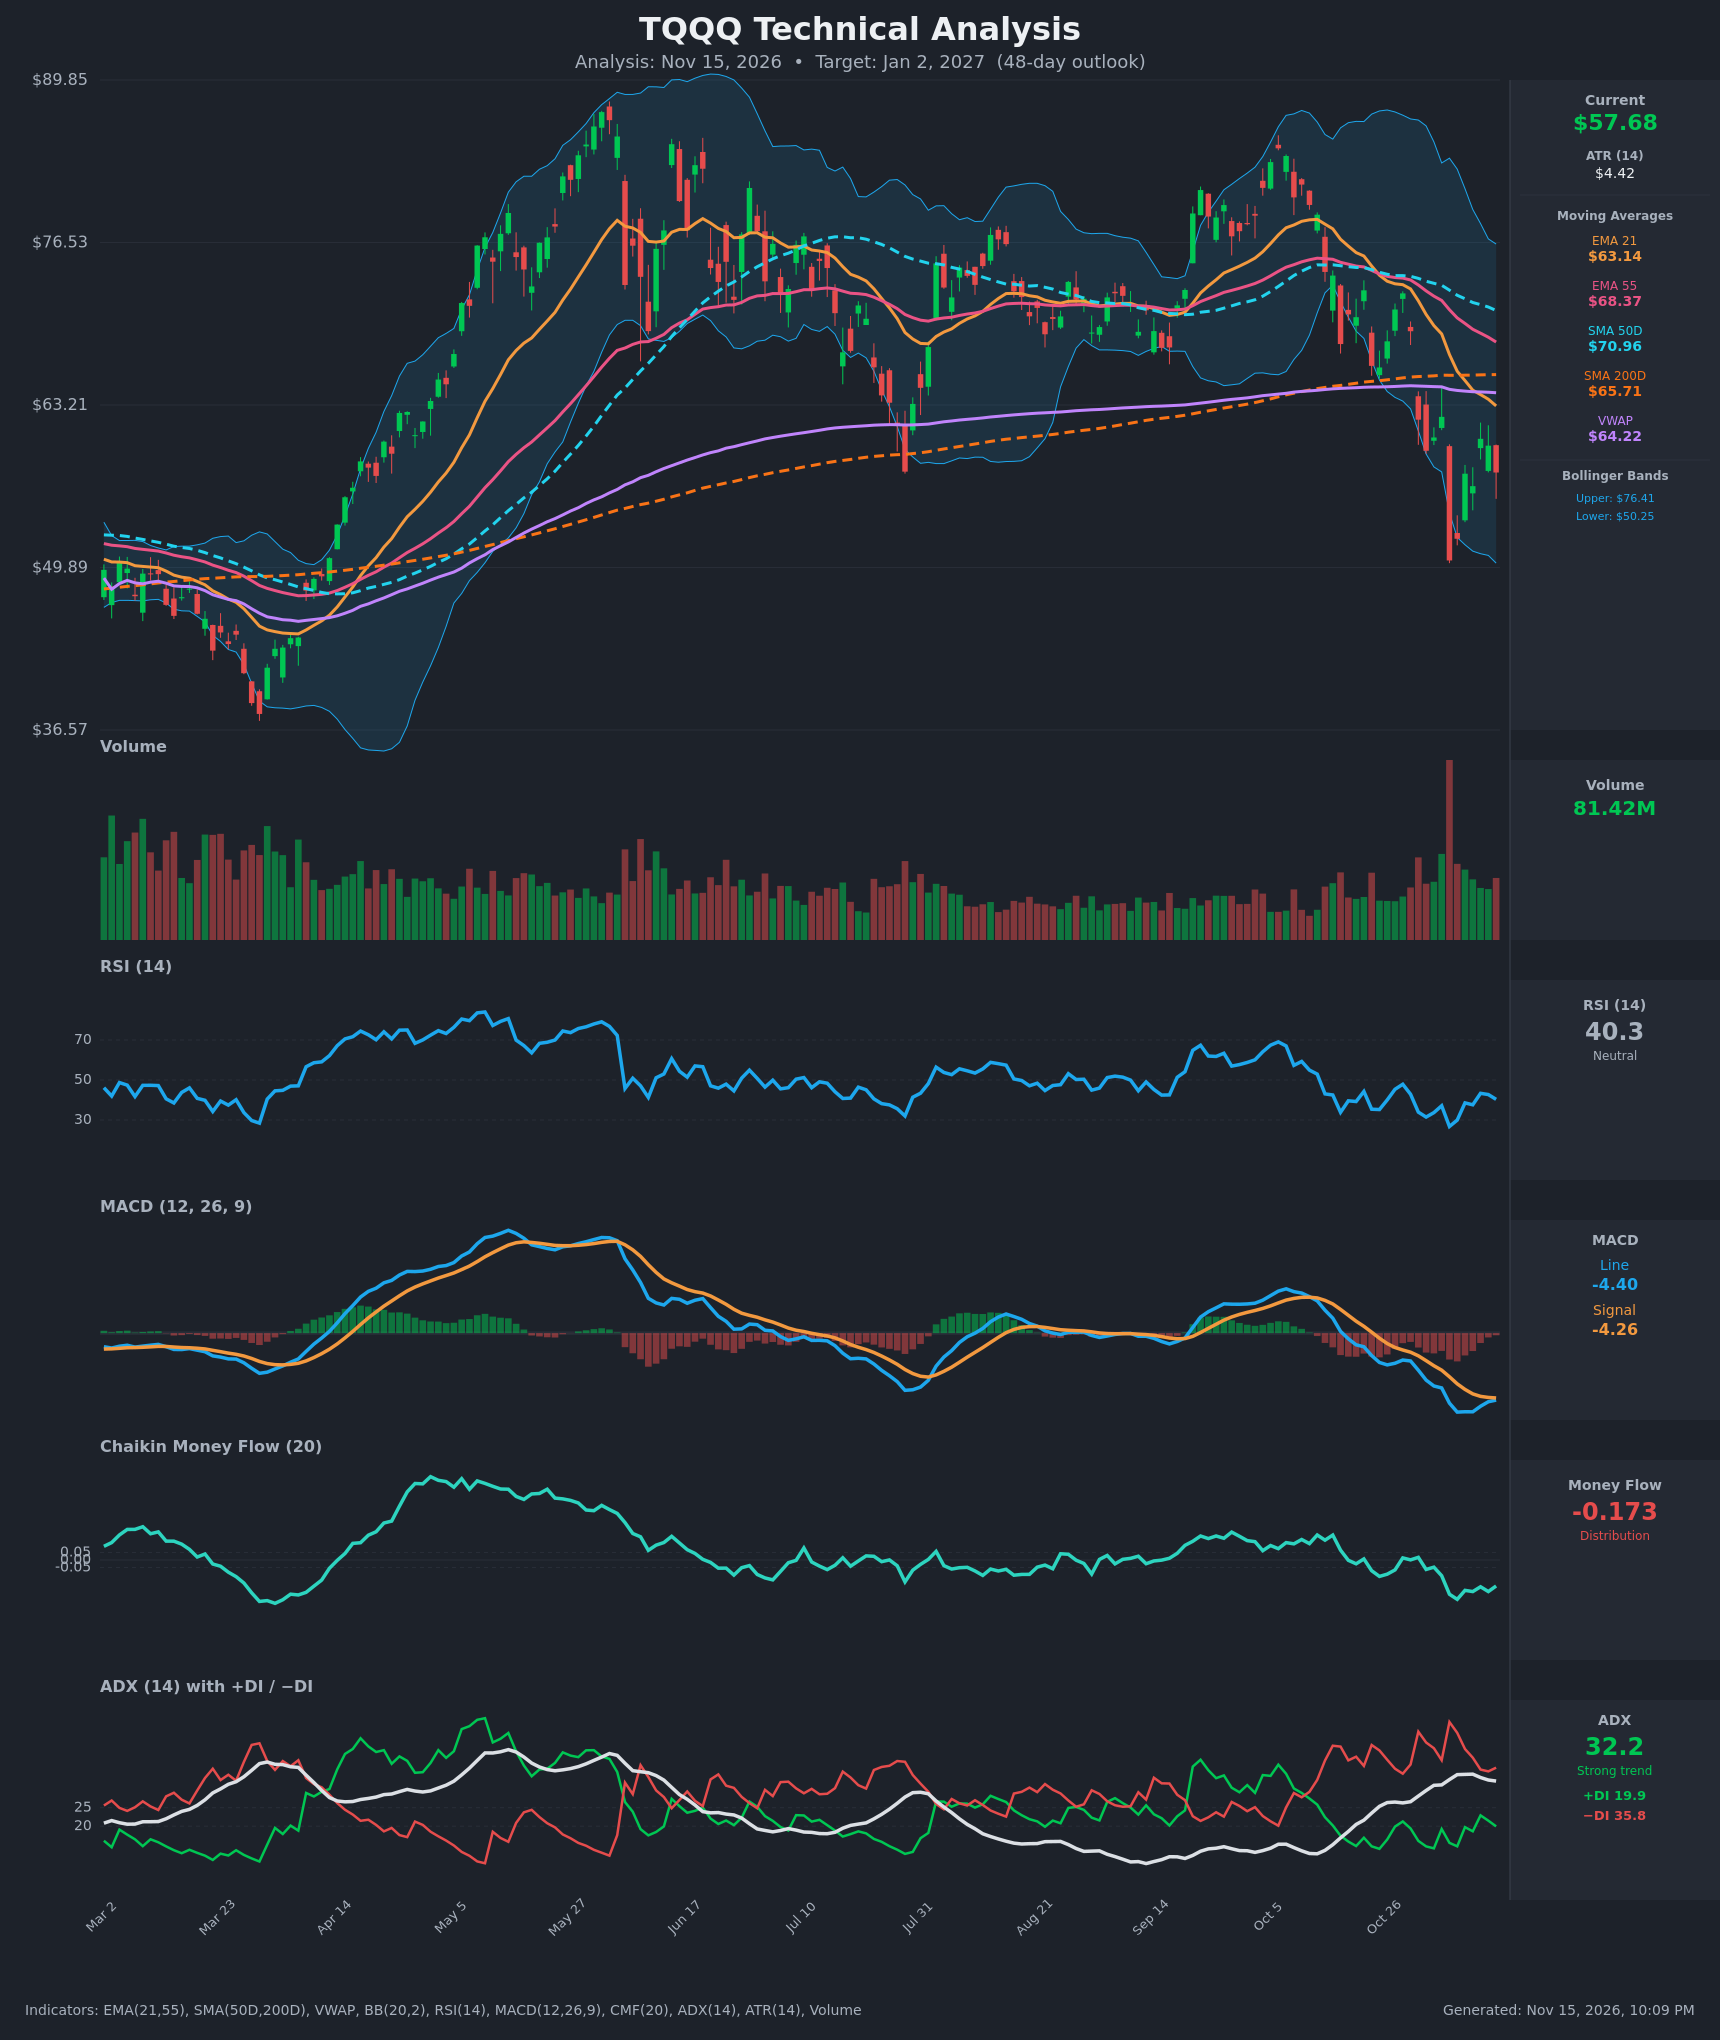
Analysis
TECHNICAL INDICATORS
- RSI (14): 40.32, below the 50 midline and off the 26.8 oversold low of Nov 5. It has bounced and is now rolling over (43.3 → 40.3), so momentum is still weak with no bullish divergence. [Bearish]
- 20 EMA: The 21 EMA is $63.14 and price at $57.68 is about 8.6% below it. The EMA is falling steeply (73.36 → 63.14 in 15 bars) and acts as overhead resistance. [Bearish]
- MACD: Line -4.40 vs signal -4.26, so the line is just below the signal. The line had been converging toward the signal, but the histogram is slightly negative (about -0.14) and a bearish crossover is still in force. Both lines are deeply negative. [Bearish]
- Bollinger Bands (20): Upper $76.41, lower $50.25, midline about $63.3. Price is in the lower half, below the midline, after a Nov 5 flush to the lower band (about $50). The bands are wide, so volatility is elevated. Price is not oversold at the band now, which leaves room for another leg down. [Bearish]
- CMF (20): -0.173, well below -0.05 and near the low of this cycle, so distribution/selling pressure is heavy. [Distribution]
- ADX (14): 32.2 with −DI 35.8 vs +DI 19.9. That is a strong trend with bears firmly in control. ADX is easing slightly from 34.1, but the DI spread is still wide. [Strong Trend – Bearish]
- Volume: 81.42M on the latest bar. The Nov 5 capitulation bar was the largest in the series, and volume has stayed elevated since. The heavy volume on the breakdown confirms selling conviction, and the bounce has not been backed by comparable buying. [Bearish/Elevated Selling]
DIVERGENCES & TRENDS
- No bullish RSI or MACD divergence is visible. The RSI low of 26.8 on Nov 5 coincided with the price low, and the subsequent lower RSI high (43.3 vs 47.9 on Oct 28) reflects fading momentum.
- Moving average structure: EMA21 ($63.14) < EMA55 ($68.37) < SMA50D ($70.96), all falling. The EMA21 crossed below EMA55 around Nov 2-3 and the price is now below the SMA200D ($65.71). The SMA50D remains above the SMA200D, so there is no death cross yet, but the gap is narrowing (about $5.2).
- Price is below VWAP ($64.22), which confirms seller control.
- The MACD line is flattening toward the signal. A short-term bounce is possible, but the line is still below it.
- ADX has been rising from about 20 to the low 30s with −DI dominant, so the downtrend is maturing but still strong.
- Price has made a lower high ($72.36 on Oct 28 vs. higher peaks in early October) and a lower low ($50.47), so the downtrend structure is intact.
CHART PATTERNS
- Bearish Flag / bear relief rally: After the sharp drop from about $72 to $50, price has retraced to the $57-62 area in a choppy bounce. This resembles a bearish flag or pennant continuation, and a break below about $56 (the lower end of the bounce) would project down toward $45-50.
- Failed range / breakdown: TQQQ spent Aug-Oct in a $68-72 consolidation and broke down through the 200-day and the range lows. The measured move points toward the mid-$40s, near the March lows around $38-45.
- Resistance cluster: the SMA200D ($65.71), VWAP ($64.22) and EMA21 ($63.14) sit at $63-66, which makes a strong supply zone.
POTENTIAL SCENARIOS
- Scenario 1: Bearish Continuation Lower — The bounce fails below the $63-66 moving average cluster and sellers retest and break the Nov 5 low. Trigger: close below $56 and then $50.25 (lower band). Target: $46-$50 on the way to $44. Invalidation: daily close above $66 (SMA200D). (50% probability)
- Scenario 2: Neutral Choppy Base — Price consolidates between $50 and $63 as volatility compresses after the capitulation. Trigger: holds $52-$54 with declining volume. Target: $54-$62 range. Invalidation: break below $50 or above $66. (25% probability)
- Scenario 3: Bullish Relief Rally / Reclaim — A sharp mean-reversion rally takes price back through the EMA21 and VWAP to the SMA200D. Trigger: close above $63.14 with CMF turning positive. Target: $65.70-$70. Invalidation: rejection at $64-66 and a close back below $57. (25% probability)
PRICE TARGETS
- Target Price: $53.50 (48-day horizon, Jan 2, 2027)
- Expected Range: $44.00 to $63.00 (width $19 ≈ 33% of the current price; wide because TQQQ is a 3x leveraged ETF with ATR of $4.42 (7.7% of price) in a strong downtrend)
- Key Levels: Support at $50.25 (lower Bollinger Band / Nov 5 low zone), Resistance at $63.14 (EMA21, with VWAP $64.22 and SMA200D $65.71 just above)
OVERALL BIAS
OVERALL BIAS: BEARISH - Price is below every key moving average and VWAP, −DI dominates at 35.8 vs 19.9 with ADX above 30, CMF at -0.173 shows heavy distribution, and MACD and RSI are below their midlines with no divergence. The bounce is likely a bear-flag retracement that stalls under $63-66 resistance.
This is educational analysis and not financial advice.