TQQQ 34-day bearish forecast — Nov 15, 2026
- Bias: Bearish
- Timeframe: 34 days (made Nov 15, 2026, target date Dec 18, 2026)
- Price at analysis: $57.68
- Price target: $55.00
- Expected range: $49.80 – $59.80
- Result: Pending — graded after the close on Dec 18, 2026
Get a free AI analysis of TQQQ today
Analysis
TECHNICAL INDICATORS
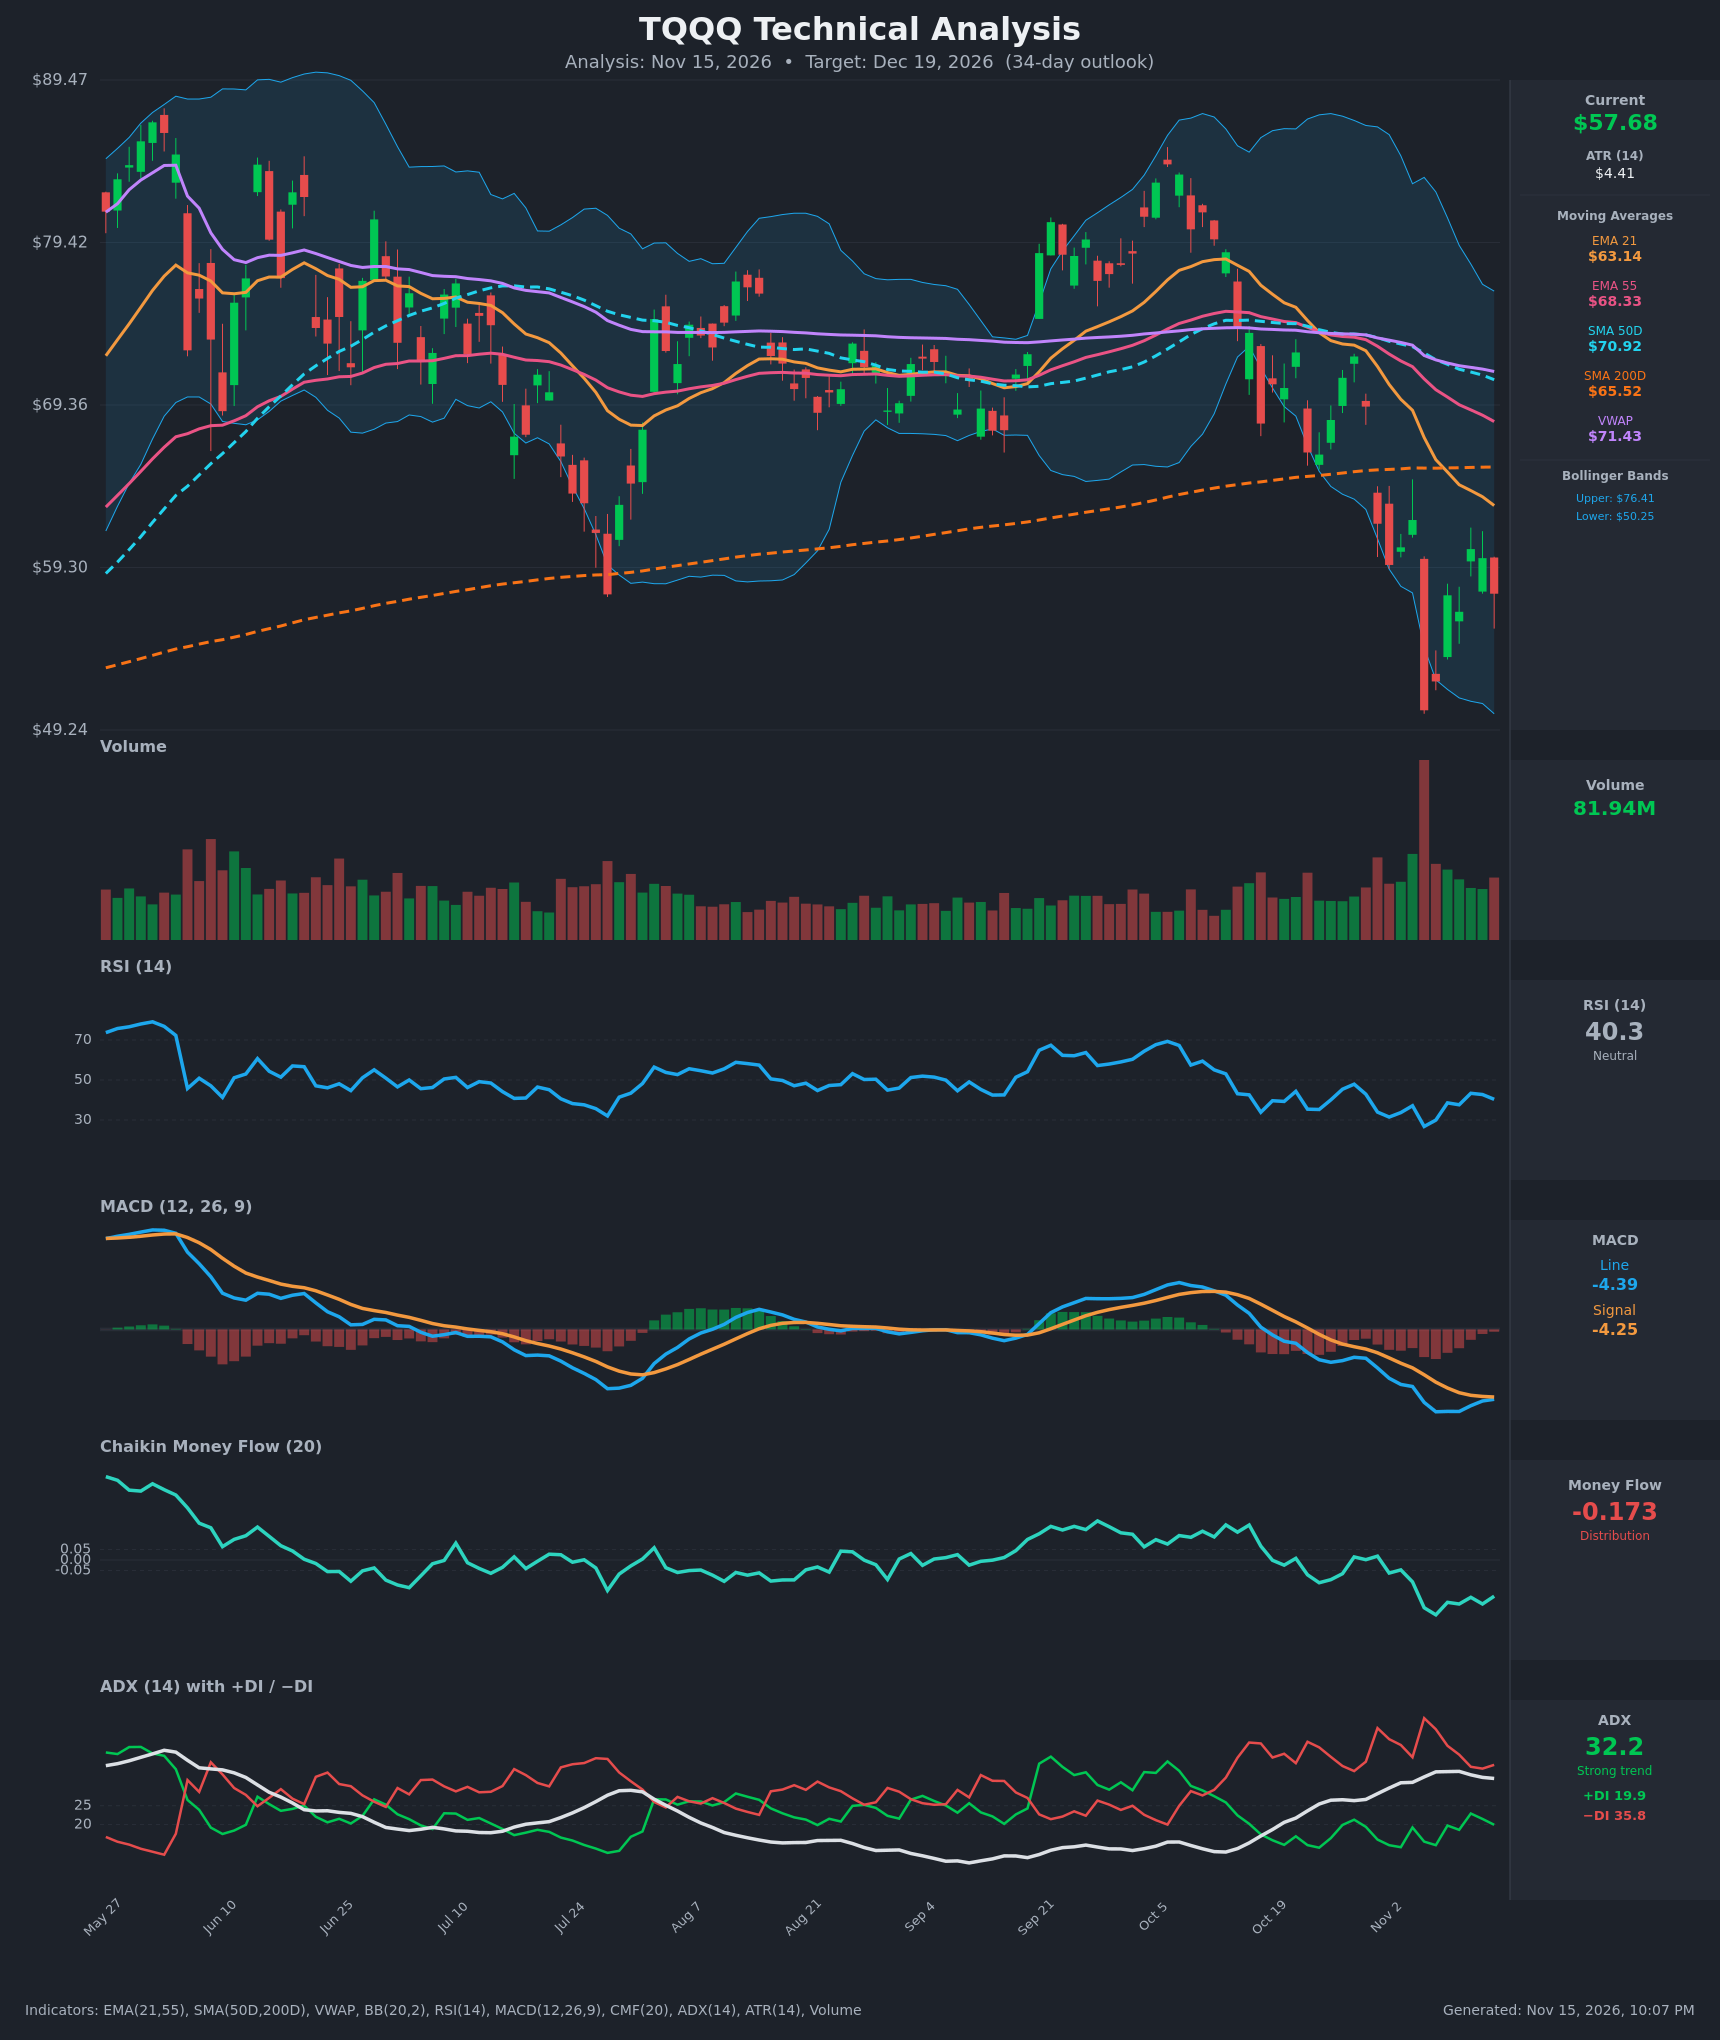
- RSI (14): 40.33, below the 50 midline and recovering from an oversold 26.8 on Nov 5. The bounce stalled at 43.3 on Nov 11 and is now rolling over (43.3 → 42.7 → 40.3). Momentum is weak with no bullish regime shift. [Bearish]
- 20 EMA: The data gives EMA 21 at $63.14, with price at $57.68 about 8.6% below it. It is falling steeply and acts as overhead resistance. EMA 21 is also well below EMA 55 ($68.33), a bearish alignment. [Bearish]
- MACD: Line -4.39 is below signal -4.25, a histogram of about -0.14. The line is deeply negative and made new lows on Nov 6-10. A brief histogram narrowing on Nov 11-12 reversed on Nov 13, so there is no bullish crossover. [Bearish]
- Bollinger Bands (20): Upper $76.41, lower $50.25, midline about $63.3. Price is in the lower half, about 29% of the band width above the lower band. The bands are wide after the volatile selloff, and the Nov 5 close at $50.47 tagged the lower band. This is a bounce off the band, but price is failing under the midline. [Bearish]
- CMF (20): -0.173, well below -0.05 and near the cycle low. Distribution has been sustained since late October with no accumulation on the bounce. [Distribution]
- ADX (14): 32.2 and rising, a strong trend. −DI (35.8) is far above +DI (19.9), so bears are in control. The brief +DI upturn to 22.9 on Nov 11 faded. [Strong Trend – Bearish]
- Volume: 81.94M on the latest bar, with a huge climactic spike on the Nov 5 breakdown (the largest in the window). The Nov 5 flush looks like capitulation, but the bounce since has come on fading volume, which is not strong buying demand. [Bearish with capitulation caveat]
Other trend context from the data:
- Price is below the SMA200D ($65.52), SMA50D ($70.92) and VWAP ($71.43), so it is below all the major reference lines.
- EMA21 crossed below EMA55 in October.
- SMA50D ($70.92) is still above SMA200D, so there is no death cross yet, but SMA50D is rolling over and the gap is narrowing.
DIVERGENCES & TRENDS
- No bullish divergence: RSI's Nov 5 low (26.8) was deeper than its earlier lows, and MACD is making lower lows. There is no momentum divergence to support a reversal.
- Lower highs: The bounce peaked at $62.24 (Nov 4) and then $60.44 (Nov 11), with RSI lower highs at 43.3 versus 47.9 in late October.
- Trend indicators: MACD is below signal and falling, ADX is rising with −DI dominant, and CMF is deeply negative, all pointing the same way.
- Support breakdown: Price lost the SMA200D (about $65.5) in late October and has failed to reclaim it.
- Compression and mean reversion: A tentative histogram narrowing and a bounce from the lower band suggest short-term mean reversion. Without a MACD cross, RSI above 50, or CMF above 0, the bounce looks corrective.
CHART PATTERNS
- Bearish Flag / Pennant (continuation): After the sharp drop from about $72 to $50, price is consolidating in a small range of $50-$62 with lower highs. A break below about $55-56 would resolve it downward, and the flag's measured move points to $50 and potentially lower.
- Failed Bullish Double Bottom: There was a possible double-bottom attempt near $50, but it needs a close above about $62-63 (EMA21 and the recent swing highs) to confirm. That has not happened.
- Earlier structure: The October rally to about $85 and the roll-over look like a reversal from a Bearish Double Top / lower-high structure, which has now played out.
- Targets: Downside is the $50.25 band and the Nov 5 low zone ($49.24-$50.47). A close below there opens the mid-$40s. Upside for a relief bounce is $60.44, then $63-65.
POTENTIAL SCENARIOS
- Scenario 1: Bearish Trend Continuation — Bears are in control with ADX above 30, −DI dominant, and distribution continuing. The bounce fails under the EMA21 and price retests the $50 zone. Trigger: close below about $55.50 and then below $52.25 (Nov 6 close). Target: $50-$53, with an extension to the high-$40s if $49.24 breaks. Invalidation: daily close above $63.14 (EMA21). (52% probability)
- Scenario 2: Bullish Relief Rally — Capitulation volume on Nov 5 and the lower-band tag set up an oversold bounce into resistance. Trigger: close above $60.44 with RSI above 50 and a MACD bullish cross. Target: $63-$65.50 (EMA21 and SMA200D), with a stretch toward the $68 EMA55. Invalidation: close below $52. (33% probability)
- Scenario 3: Neutral Range — Price chops between about $52 and $61 as ADX cools. Trigger: failed breaks on both sides. Target: $55-$60. Invalidation: close outside $50-$63. (15% probability)
PRICE TARGETS
- Target Price: $55.00 (34-day outlook, about 4.6% below the current $57.68)
- Expected Range: $49.80 to $59.80 (width $10.00, about 17.3% of current price, in line with the 30-60 day guidance of 12-18%)
- Key Levels: Support at $50.25, Resistance at $60.44
OVERALL BIAS
OVERALL BIAS: BEARISH - Price is below every key moving average and VWAP, MACD is below signal and falling, ADX is strong at 32 with −DI far above +DI, and CMF shows heavy distribution. The bounce since the Nov 5 capitulation is stalling below the EMA21 on fading volume, so a retest of the $50 zone is more likely than a full recovery, though an oversold relief rally is a real risk.
This is educational analysis and not financial advice.