TQQQ 62-day bearish forecast — Nov 15, 2026
- Bias: Bearish
- Timeframe: 62 days (made Nov 15, 2026, target date Jan 15, 2027)
- Price at analysis: $57.68
- Price target: $54.50
- Expected range: $47.50 – $62.00
- Result: Pending — graded after the close on Jan 15, 2027
Get a free AI analysis of TQQQ today
Analysis
TECHNICAL INDICATORS
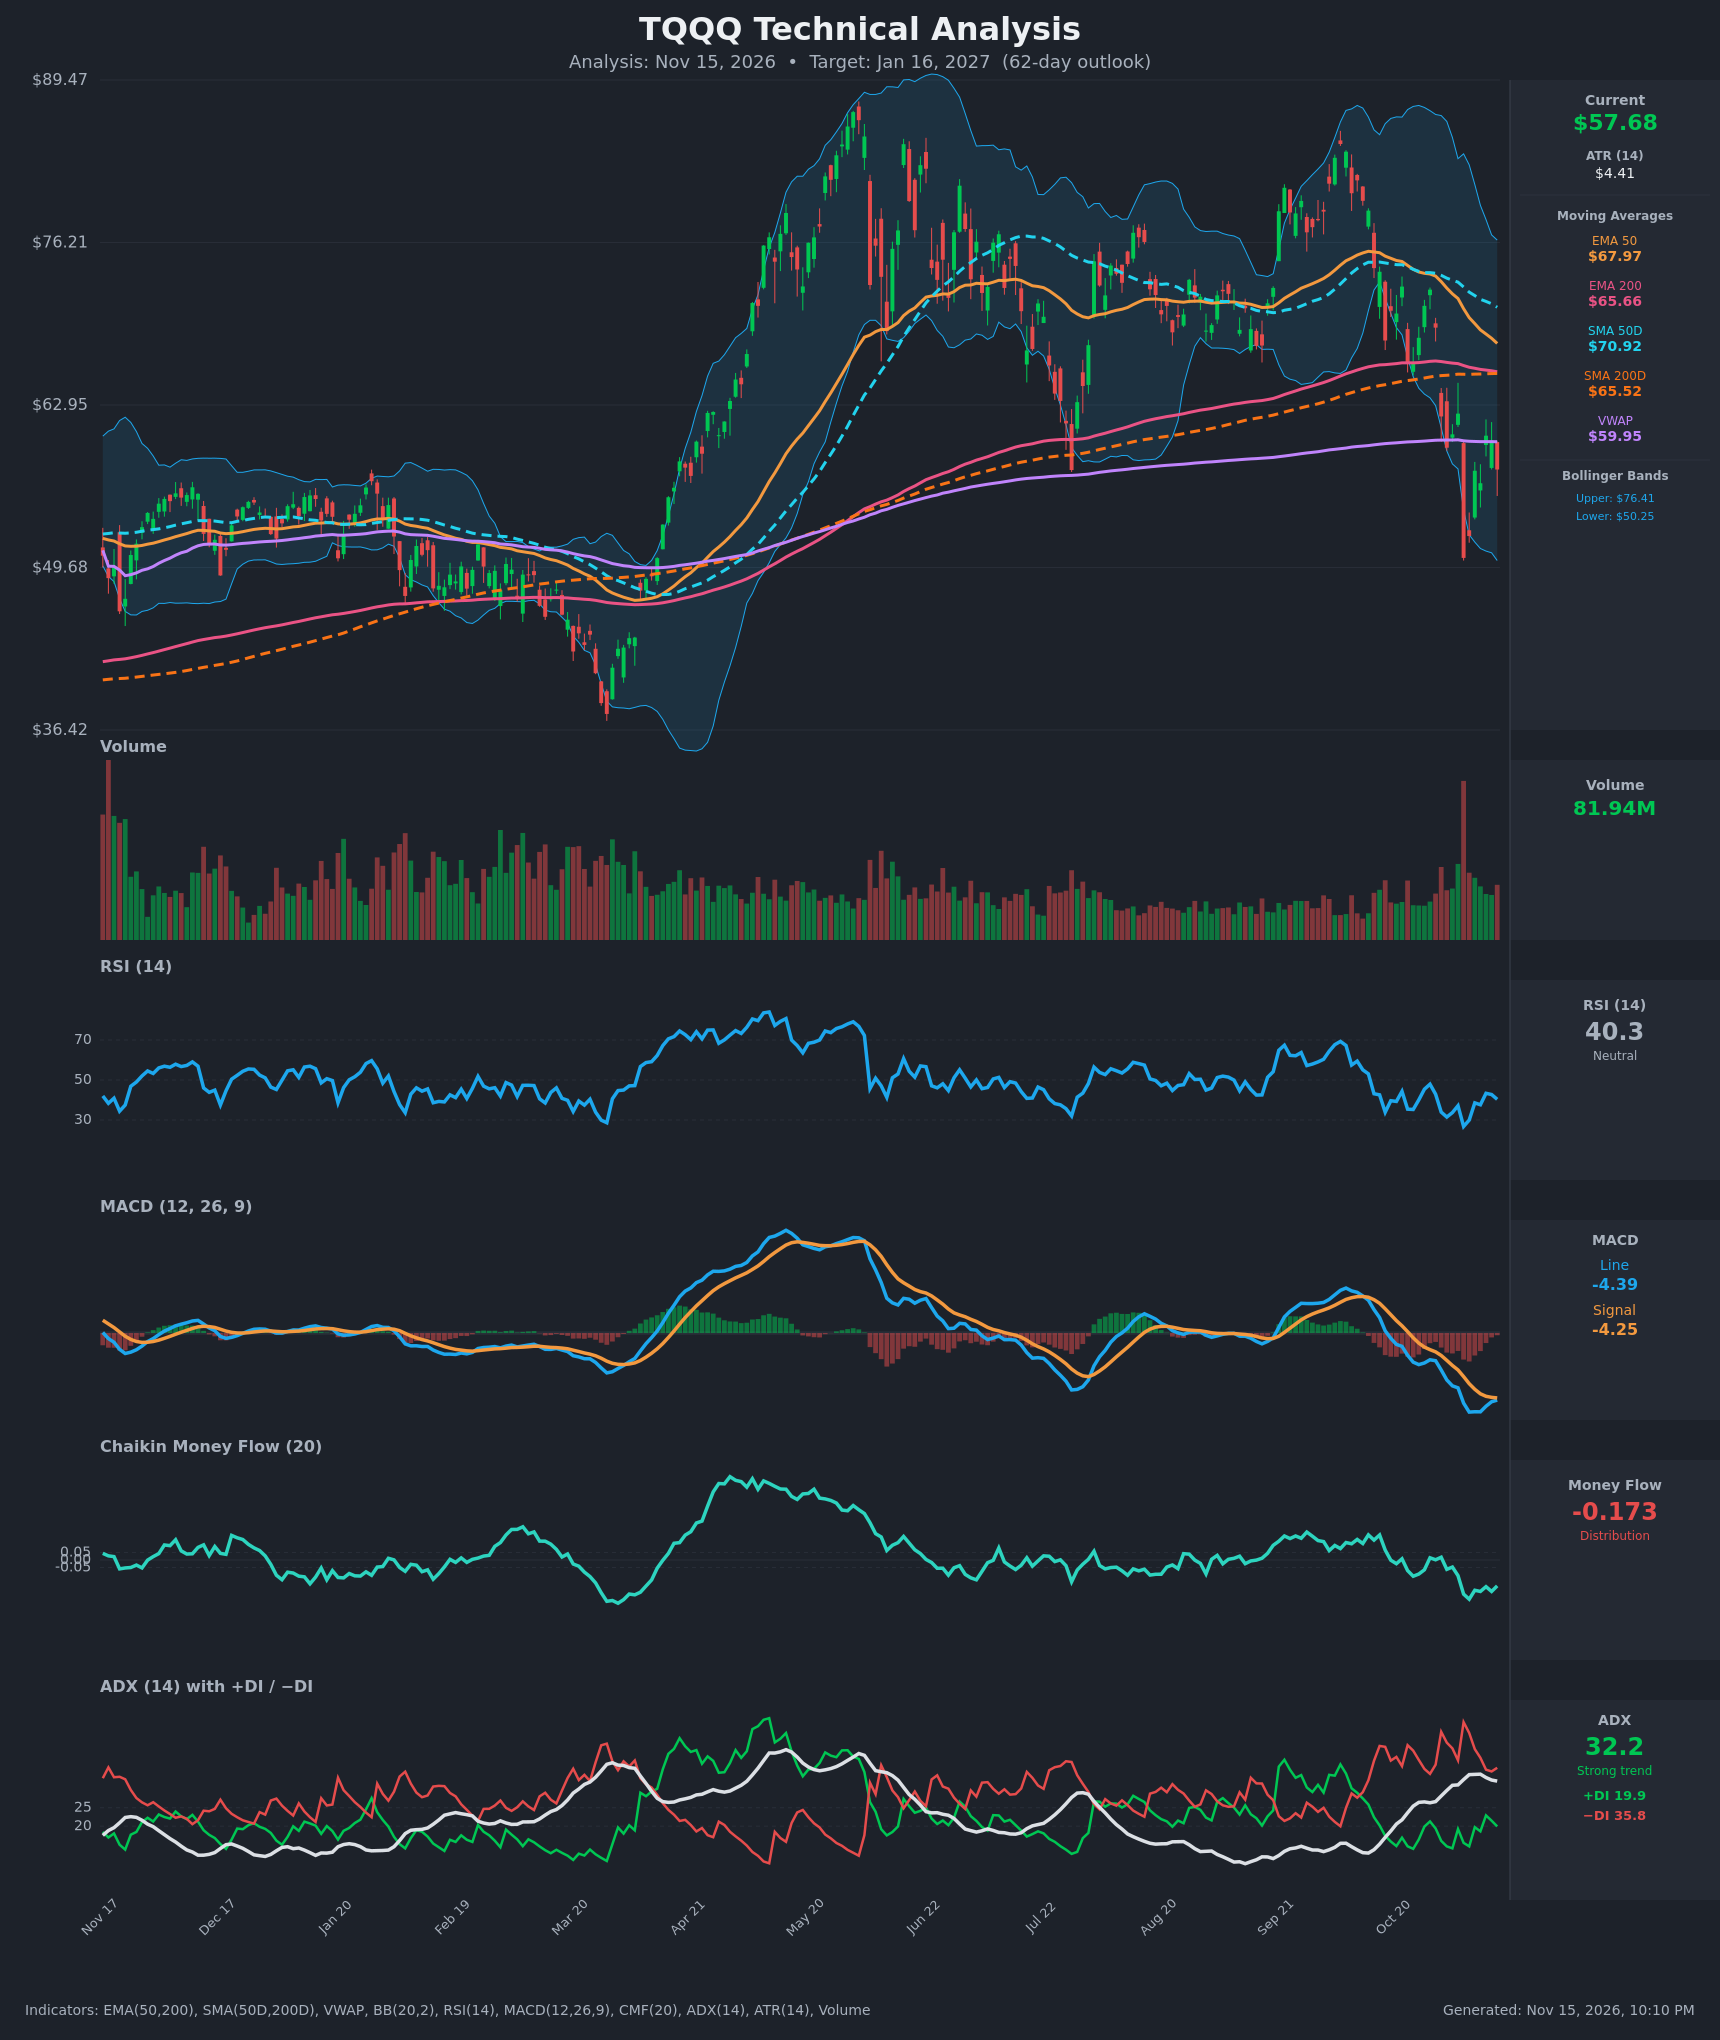
- RSI (14): 40.33, below the 50 midline but above the oversold zone. It bottomed at 26.8 on Nov 5 and has bounced to the low 40s, making lower highs near 43-45 as price fails to reclaim 60+. Momentum is weak but no longer washed out. [Bearish]
- 20 EMA: Not supplied. The EMA 50 ($67.97) and EMA 200 ($65.66) are both well above the $57.68 price, so the moving averages act as overhead resistance. The EMA 50 is falling steadily (73.80 → 67.97 over 15 bars) and converging on the EMA 200. [Bearish]
- MACD: Line -4.393 is below signal -4.250, a histogram of about -0.14. The histogram has narrowed sharply from roughly -1.8 on Nov 5-10, so downside momentum is fading and a bullish crossover is possible. Both lines sit deep below zero, which is still a bearish regime. [Bearish]
- Bollinger Bands (20): Upper $76.41, lower $50.25, midline about $63.3. Price is in the lower half of the bands, about 29% of the way from the lower band to the upper. It tagged the lower band on the Nov 5 flush ($50.47) and rebounded. The bands are wide (high volatility), and the midline is overhead resistance. [Bearish]
- CMF (20): -0.173, well below -0.05 and near the lows of the past year. It shows persistent distribution with no sign of accumulation on the bounce. [Distribution]
- ADX (14): 32.2 and still elevated. −DI (35.8) is far above +DI (19.9), so bears control a strong trend. ADX has risen from 26 to 34 and is now rolling over slightly, which hints at trend exhaustion. [Strong Trend – Bearish]
- Volume: 81.94M. There was a huge volume spike on the Nov 5 breakdown (about -19% in a day) and elevated volume since. Heavy volume on the capitulation candle followed by fading volume on the bounce is typical of a relief rally inside a downtrend. [Bearish with capitulation signs]
DIVERGENCES & TRENDS
- Price vs. long-term averages: Price is below the SMA200D ($65.52), EMA 200 ($65.66), EMA 50 ($67.97) and SMA50D ($70.92), which is a structural downtrend. Price is also below VWAP ($59.95), so sellers hold the near-term edge.
- MACD: The histogram is converging toward zero (-1.8 → -0.14) while price made a lower low on Nov 5. This is a mild momentum improvement and is not yet a confirmed bullish divergence. The lines are within 0.14 of crossing.
- RSI: The Nov 5 low of 26.8 was followed by a bounce to 43.3 and a roll back to 40.3. This is a relief rally that is stalling below 50.
- Moving-average crossovers: The SMA50D ($70.92) is above the SMA200D ($65.52), but the gap has narrowed from about 8.8 to 5.4 in 15 bars. The EMA 50 is only about $2.3 above the EMA 200. A death cross (EMA first, then SMA) is plausible within the 62-day window if price stays below $65.
- ADX/DI: −DI has been above +DI for the whole window. ADX is plateauing, so the pace of the decline may slow.
- CMF: It has been negative for most of the past 15 bars and has made a new low, with no divergence.
CHART PATTERNS
- Bearish Double Top (Reversal): The May peak (about $89) and the September peak (about $85) form two highs. The neckline is the July trough near $56-57, which price has already broken below. The measured move is very large, so I treat it as a directional signal and not a literal target for 62 days.
- Bearish Flag / Pennant (Continuation): The sharp flush from about $72 to $50.47 followed by a choppy bounce between $52 and $62 resembles the early stage of a bearish flag. A break below about $50 would project toward the low-to-mid $40s.
- Context: The $50-52 area is support from the June-July lows and the Nov 5 capitulation low. The $60-66 zone (VWAP, SMA200D, EMA 200) is a thick resistance cluster.
POTENTIAL SCENARIOS
- Scenario 1: Bearish Trend Continuation — Price rolls over from the VWAP/200-day resistance zone, retests the Nov 5 low, and slips toward the low $50s or below as the moving averages cross bearishly. Trigger: rejection at $60-62 or a daily close below $55 with −DI staying above +DI. Target: $50.25, then $46-48 if that breaks. Invalidation: a daily close above $66 (SMA200D/EMA 200 reclaimed). (45% probability)
- Scenario 2: Bullish Relief Rally — Capitulation volume and a narrowing MACD histogram trigger a mean-reversion bounce toward the declining moving averages. Trigger: MACD bullish crossover plus a close above VWAP ($59.95) and then $62. Target: $65-67 (SMA200D/EMA 200/EMA 50 cluster). Invalidation: a close below $50.25. (33% probability)
- Scenario 3: Neutral Choppy Base — Price ranges between support near $50-52 and resistance near $62 while volatility contracts. Trigger: repeated failure on both sides, with ADX falling below 25. Target: $52-62 range. Invalidation: a close outside $50 or $66. (22% probability)
PRICE TARGETS
- Target Price: $54.50 (62-day, Jan 16, 2027)
- Expected Range: $47.50 to $62.00 (width $14.50, about 25% of the current price, which fits the 18-30% guidance for 61-180 days)
- Key Levels: Support at $50.25, Resistance at $59.95
OVERALL BIAS
OVERALL BIAS: BEARISH - Price is below all key moving averages and VWAP, −DI dominates a strong ADX of 32, CMF shows heavy distribution, and MACD is deeply negative. The fading downside momentum and capitulation volume argue for a bounce along the way, so conviction is moderate, and the target sits only modestly below the current price.
This is educational analysis and not financial advice.