TQQQ 83-day bearish forecast — Nov 15, 2026
- Bias: Bearish
- Timeframe: 83 days (made Nov 15, 2026, target date Feb 5, 2027)
- Price at analysis: $57.68
- Price target: $53.50
- Expected range: $46.50 – $60.00
- Result: Pending — graded after the close on Feb 5, 2027
Get a free AI analysis of TQQQ today
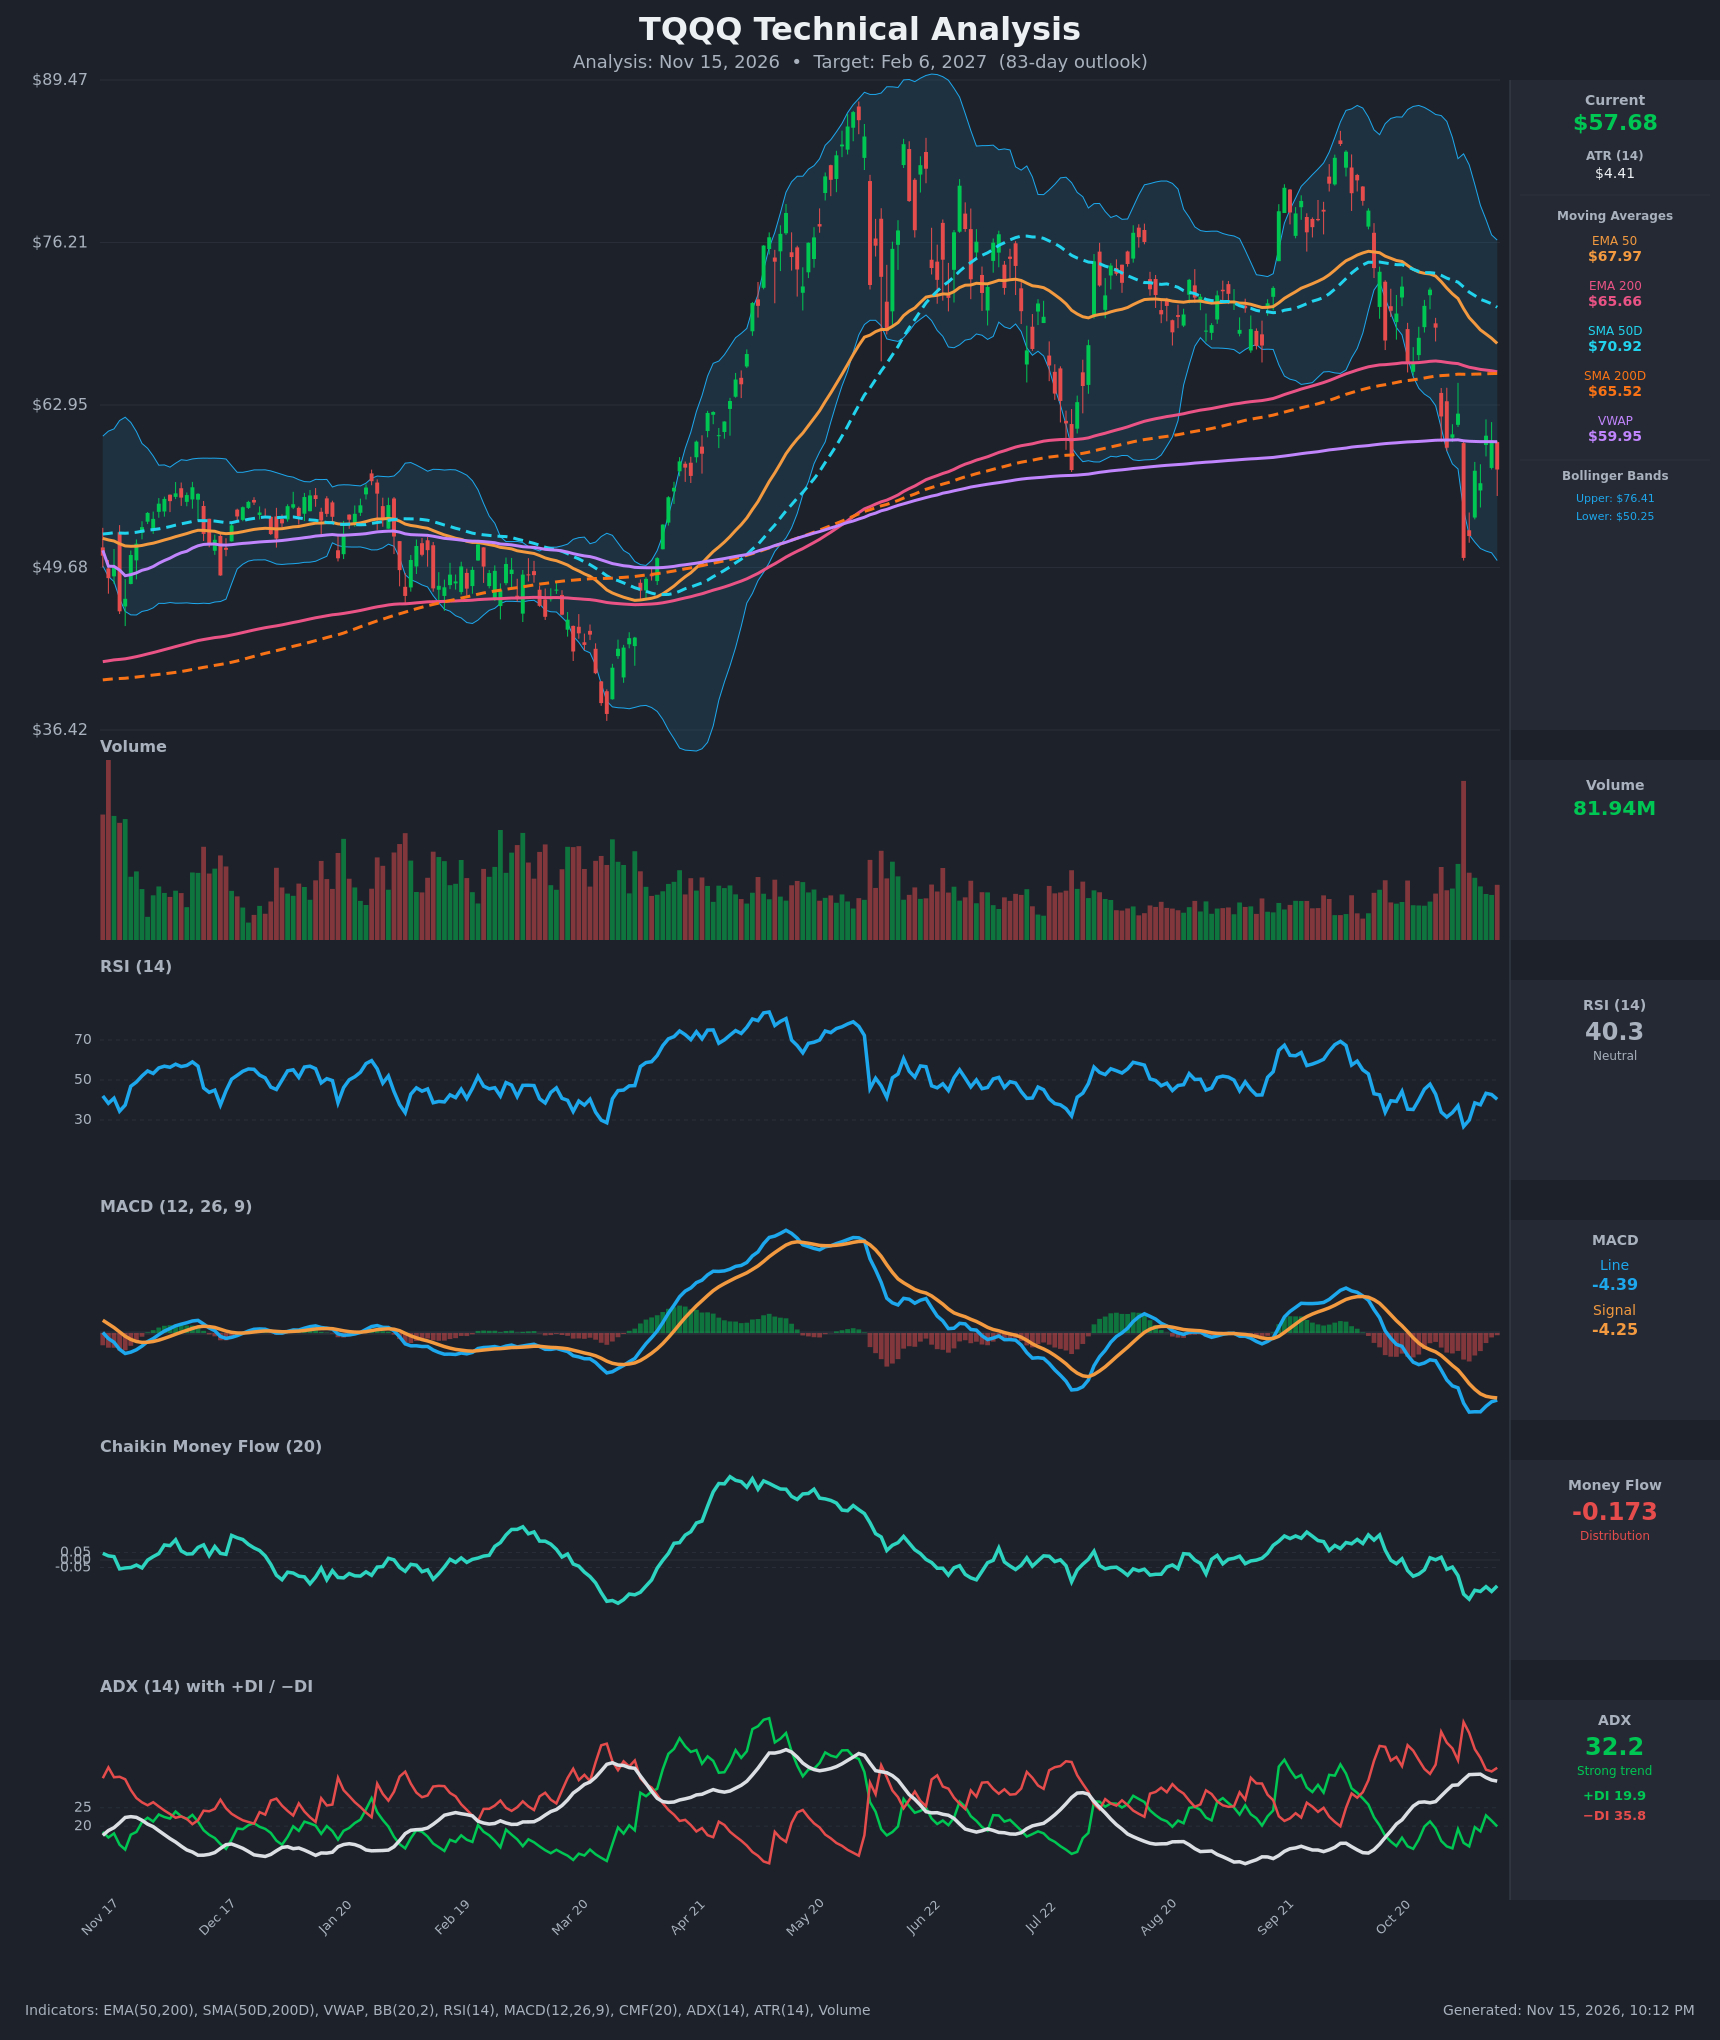
Analysis
TECHNICAL INDICATORS
- RSI (14): 40.33, below the 50 midline and recovering from an oversold 26.8 on Nov 5. The bounce stalled in the low 40s (43.3 on Nov 11, then 40.3). That is a weak, bear-market-style rebound that has not yet reclaimed 50. [Bearish]
- 20 EMA: The 20 EMA is not provided, so I use the EMA 50 as the dynamic reference. At $67.97, EMA 50 is about 18% above price and sloping down. It is a long way overhead and acts as resistance. Price is also below SMA 50 ($70.92) and VWAP ($59.95). [Bearish]
- MACD: The line is -4.39 and the signal is -4.25, so the line is slightly below the signal. The histogram is only about -0.14 after reaching roughly -1.5 on Nov 6. Momentum is deeply negative, with a bearish crossover in late October that is still in force. The fast narrowing of the histogram hints at a possible bullish re-cross, but that is not confirmed. [Bearish]
- Bollinger Bands (20): Price is $57.68, in the lower half of the bands (lower $50.25, upper $76.41, midline about $63.3). The Nov 5 capitulation wick pierced the lower band and price has rebounded off it. The bands are still wide after the volatility spike. Price is below the midline, so the bias is bearish. [Bearish]
- CMF (20): -0.173, well below -0.05, and it has held negative since late October (about -0.26 at the Nov 6 trough). This is sustained distribution with no accumulation on the bounce. [Distribution]
- ADX (14): 32.2, a strong trend. It has risen from the low 20s over the past 15 bars, though it is now easing slightly from 34.1. −DI (35.8) is far above +DI (19.9), so bears control the trend. [Strong Trend – Bearish]
- Volume: 81.94M, with a huge capitulation spike on the Nov 5 breakdown, well above the volume of the prior several months. Volume on the rebound days has been moderate, so the bounce lacks strong conviction. The spike could mark short-term exhaustion, but it also confirms the breakdown. [Bearish – heavy-volume breakdown, weak bounce]
DIVERGENCES & TRENDS
- Divergence: There is no clear bullish divergence. RSI made a higher low at about 40 versus 26.8, but price is only partway through its rebound. The MACD histogram is narrowing while price chops, which is an early momentum-stabilization signal but not a reversal.
- Moving averages: Price is now below both the SMA 200 ($65.52) and the EMA 200 ($65.66). It lost the long-term trend line during the Oct 30 and Nov 5 drops. The EMA 50 ($67.97) is converging on the EMA 200 ($65.66), a gap of only about $2.3 that is closing by about $0.4 per bar. A bearish EMA death cross looks likely within the next few weeks. The SMA 50 ($70.92) is also rolling over toward the SMA 200.
- Trend: Since Oct 28, the −DI has been dominant. The ADX shows the downtrend is established.
- VWAP: Price ($57.68) is below VWAP ($59.95), which is a near-term resistance cap. Price has been rejected from the area around $60 twice (Nov 11 and Nov 12).
- Swing structure: Lower highs (about $89 in May, then about $85 in September) are followed by a break of the July swing low area.
CHART PATTERNS
- Bearish Double Top (reversal): The May peak (about $89) and September peak (about $85) form a rough double top. The neckline sits near the July low (about $57–58), and the Oct 30 and Nov 5 drops broke it. A full measured move would be very large, but the ETF has already bounced off the lower Bollinger Band. A realistic target is a retest of the $50 area and possibly lower.
- Bearish Flag/Pennant (continuation): The Nov 5–13 bounce from $50.47 to roughly $60 is a low-volume, corrective, flag-like consolidation after a sharp drop. A break below $55–56 would project toward $50 or below.
- Caveat: The Nov 5 capitulation and long wick form a possible base, a bullish double-bottom attempt around $50. This only becomes valid on a close above roughly $60–62. Until then, it is a bear-market bounce.
- This is a 3x leveraged ETF, so volatility decay and large swings are expected.
POTENTIAL SCENARIOS
- Scenario 1: Bearish Breakdown Continuation — Price fails at the VWAP/$60 zone, the EMA 50 and EMA 200 death cross completes, and price retests and then undercuts the Nov 5 low. Trigger: daily close below $55.50, or a rejection at $60. Target: $50 first, then $46–48. Invalidation: daily close above $66 (the 200-day MAs). (50% probability)
- Scenario 2: Bullish Recovery Rally — The capitulation low holds as a double-bottom base. The MACD re-crosses up, price reclaims VWAP and then the 200-day MAs, and short covering lifts price. Trigger: close above $60.50 on rising volume. Target: $66–68 (SMA/EMA 200 and EMA 50), with an extension to $70.90 (SMA 50). Invalidation: close below $50. (30% probability)
- Scenario 3: Neutral Range Chop — Price oscillates between the $50 support and $60–62 resistance as volatility compresses. Trigger: failure to break either $50 or $62 for several weeks. Target: about $56–58. Invalidation: a decisive close outside the $50–$62 range. (20% probability)
PRICE TARGETS
- Target Price: $53.50 (83-day horizon, Feb 6, 2027)
- Expected Range: $46.50 to $60.00 (width $13.50, about 23% of the current price, consistent with the 61–180 day guidance of 18–30%)
- Key Levels: Support at $50.25 (lower Bollinger Band and Nov 5 low area), Resistance at $59.95 (VWAP, with the 200-day MAs near $65.5 as the next resistance)
OVERALL BIAS
OVERALL BIAS: BEARISH - Price sits below the 50- and 200-day averages and VWAP, with −DI far above +DI on a strong ADX (32). CMF shows sustained distribution (-0.173), and the weak rebound is stalling under $60. An EMA death cross is approaching, so a retest or break of the $50 low is the most likely path, though the narrowing MACD histogram and the capitulation bounce leave a real chance of a recovery rally.
This is educational analysis and not financial advice.