TQQQ 20-day bearish forecast — Nov 15, 2026
- Bias: Bearish
- Timeframe: 20 days (made Nov 15, 2026, target date Dec 4, 2026)
- Price at analysis: $57.68
- Price target: $55.50
- Expected range: $52.00 – $59.00
- Result: Pending — graded after the close on Dec 4, 2026
Get a free AI analysis of TQQQ today
Analysis
TECHNICAL INDICATORS
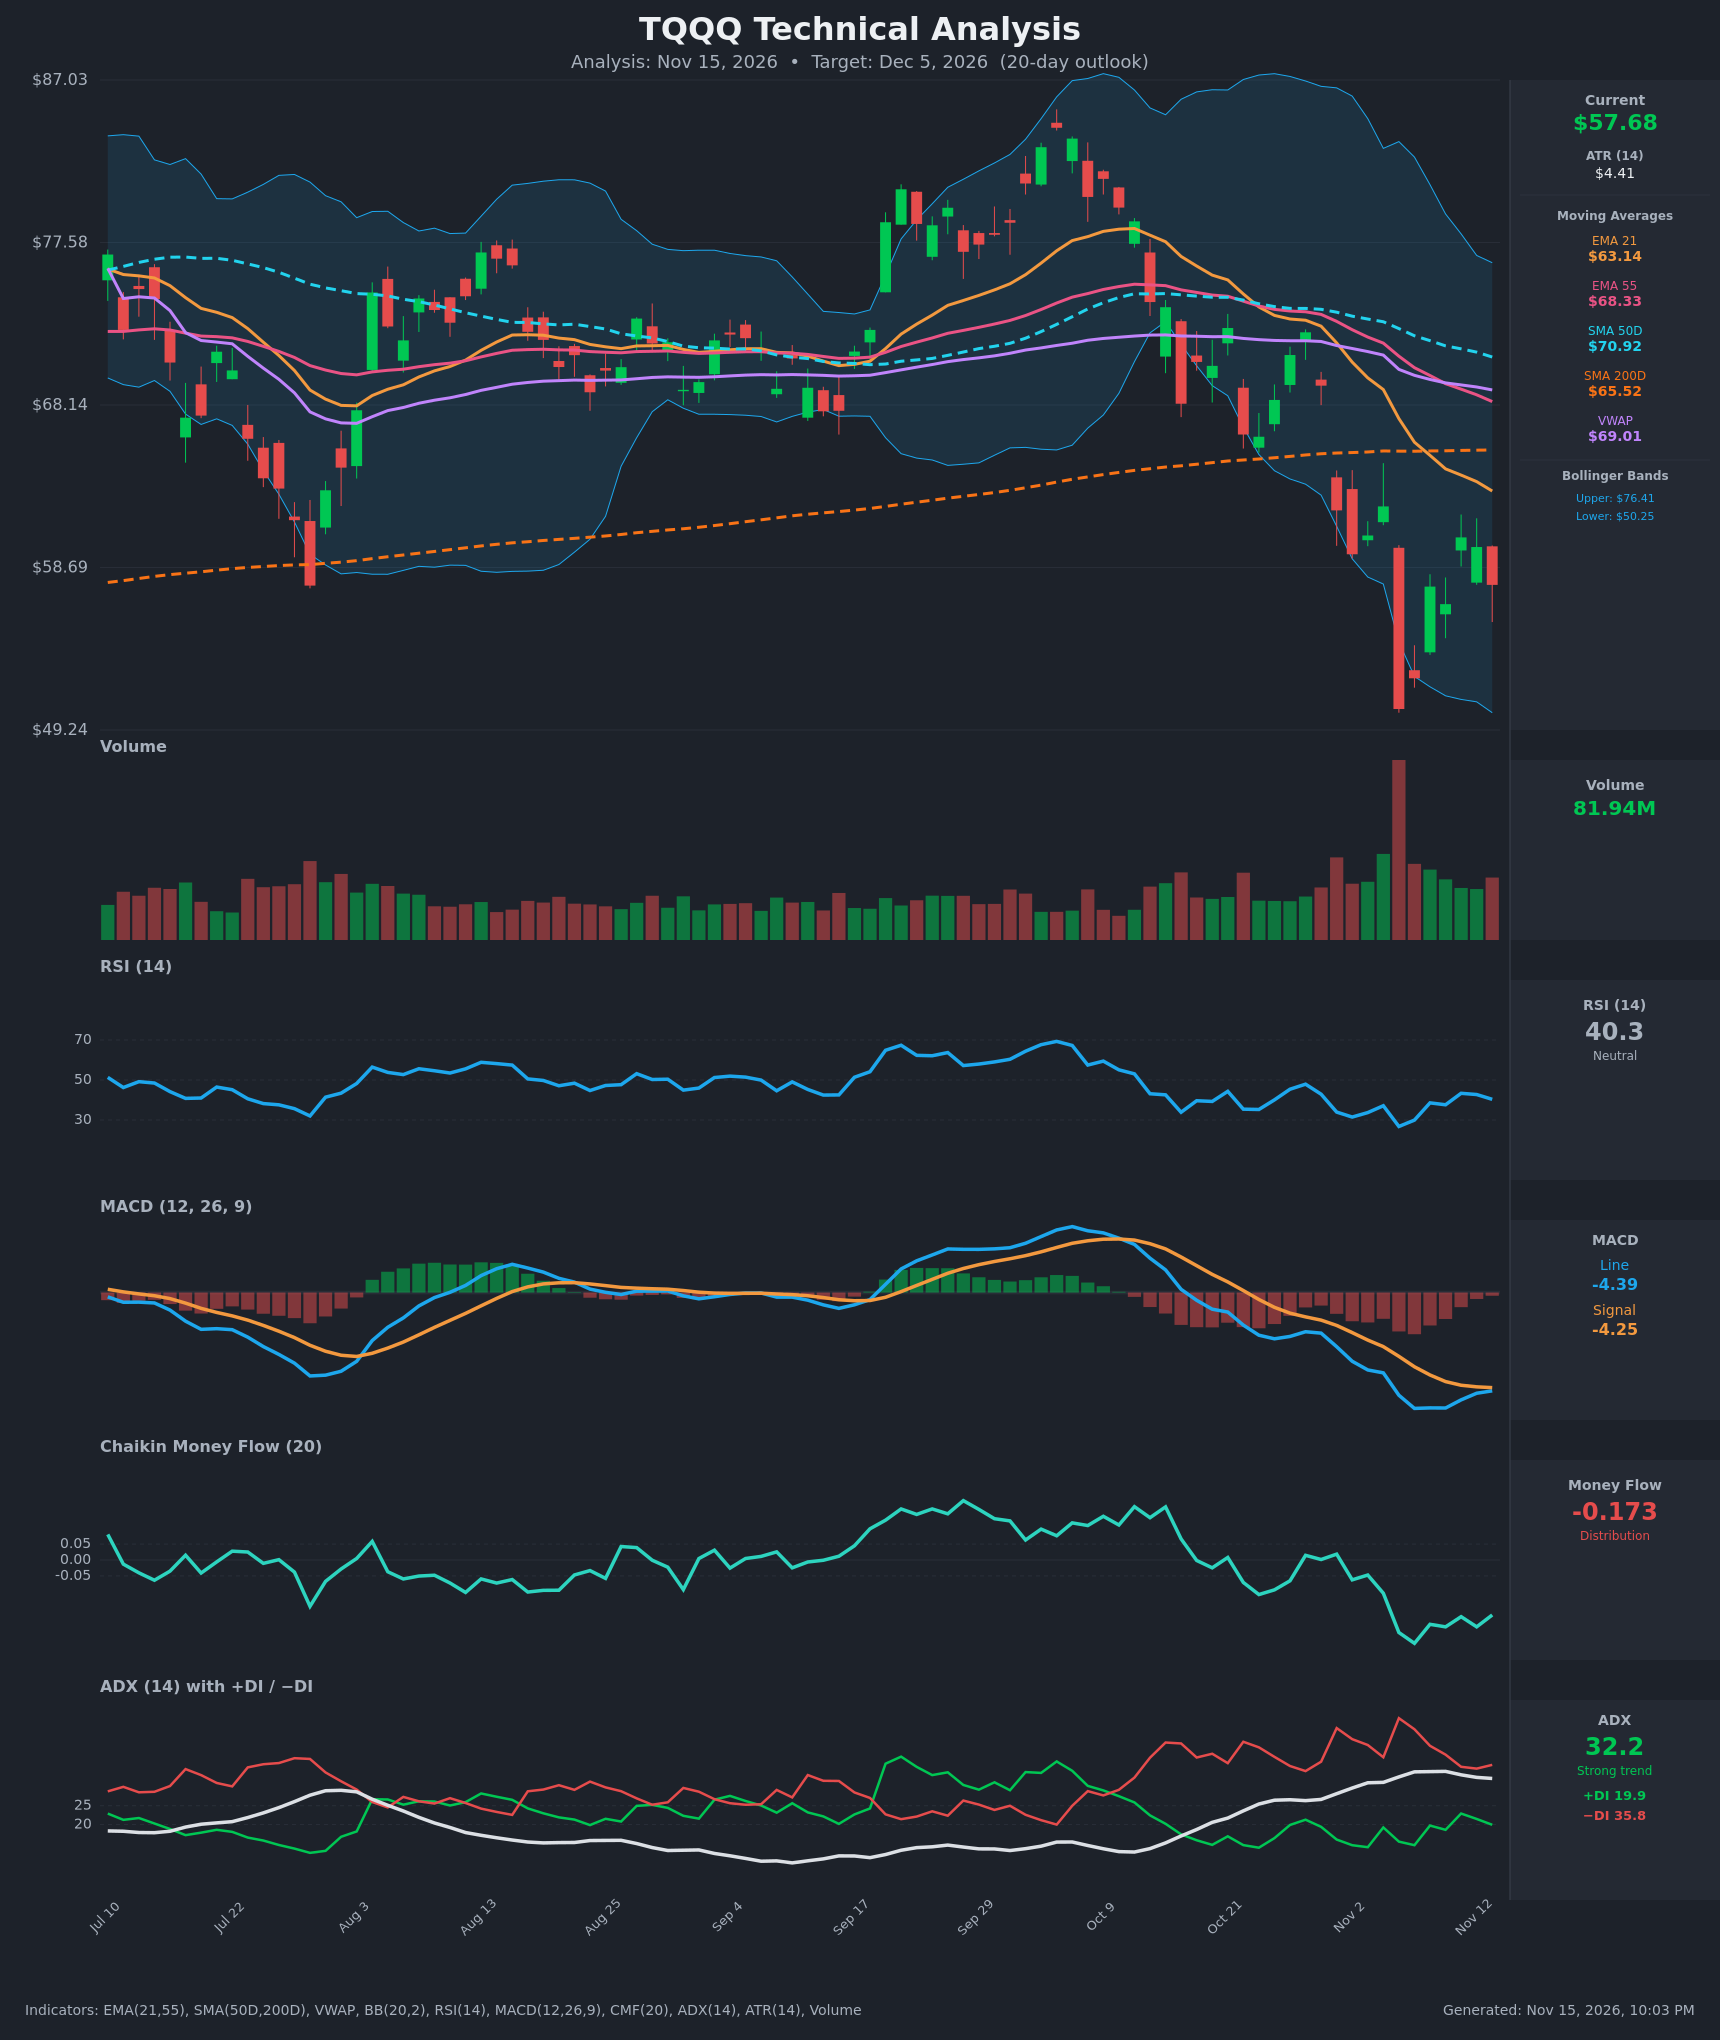
- RSI (14): 40.33, below the 50 midline but not oversold. It bottomed at 26.8 on Nov 5, bounced to 43.3 on Nov 11, and is now rolling over (43.3 → 42.7 → 40.3). It has made a lower high versus the prior rally, so momentum is fading again with room left to fall. [Bearish]
- 20 EMA: The chart shows the 21 EMA at $63.14, about 9.4% above price. It is sloping down steeply and price has been rejected below it for 8 sessions. It acts as dynamic resistance. [Bearish]
- MACD: Line -4.39 sits just below signal -4.25, a histogram of about -0.14. The histogram has narrowed from -0.65 (Nov 11) as the lines converge, which hints at slowing downside momentum. But both lines are deeply negative, and the line has not crossed back above the signal. [Bearish]
- Bollinger Bands (20): Upper $76.41, lower $50.25, midline roughly $63.3. Price at $57.68 is in the lower half, well below the midline, after the Nov 5 close at $50.47 tagged the lower band. The bands are wide, so volatility is elevated. Price is walking the lower half rather than mean-reverting. [Bearish]
- CMF (20): -0.173, well below the -0.05 threshold. It has been sustained negative since early November and made a new low around -0.26. There is no sign of accumulation on the bounces. [Distribution]
- ADX (14): 32.2, a strong trend, easing slightly from 34.1. −DI (35.8) is far above +DI (19.9), so bears are firmly in control. The −DI/+DI spread of about 16 confirms a directional downtrend. [Strong Trend - Bearish]
- Volume: 81.94M. The Nov 5 capitulation bar was the highest volume on the chart, with a long-wicked 18% drop. Subsequent bounces came on lighter volume and recent sell-offs are not exhausted. Selling volume dominates on red bars. [Bearish with capitulation risk]
Other levels from the data: the 55 EMA is $68.33, the SMA50D $70.92, the SMA200D $65.52 and VWAP $69.01. Price is below all of them. EMA21 is below EMA55, and the SMA50D is converging toward the SMA200D, which sets up a possible death cross within the horizon.
DIVERGENCES & TRENDS
- Trend structure: Lower highs and lower lows since the Oct 9 peak near $85. Price lost the SMA200D ($65.52) in the Oct 30 and Nov 5 drops, and every bounce has stalled below it.
- MA stack: Price < EMA21 < EMA55 < SMA50D, with VWAP at $69.01 overhead. Moving averages are all sloping down, which is a bearish alignment.
- Crossovers: The EMA21/EMA55 bearish cross is already in place and widening. The SMA50D (70.92) falls toward the SMA200D (65.52). The gap is shrinking by about $0.3 per day, so a death cross is plausible in the next several weeks.
- MACD: It has been below signal since late October. The narrowing histogram is a minor bullish convergence, but it would need a line/signal cross to matter.
- Divergences: There is no clear bullish RSI/price divergence. The Nov 5 low at $50.47 had RSI 26.8, and the current price is above that low with higher RSI, which is normal. The bounce, however, hasn't been confirmed by CMF, which is a bearish non-confirmation.
- DI/ADX: −DI has stayed above +DI the whole period, and ADX is above 25 and elevated, so the trend is intact.
CHART PATTERNS
- Bearish Flag / Pennant (continuation): After the sharp impulse down from about $69 to $50.47, price has formed a small, rising/sideways consolidation of lower highs, with $60.44 as the recent high. A break below the Nov 9–13 range lows (~$56.5) would project a continuation toward roughly $50–52, and a measured move of the flagpole would go lower still. The pattern is only loosely formed, so treat it as a bias rather than a confirmed signal.
- Caution, Bullish Double Bottom: The $50.47 low with a possible retest would form a double bottom if price holds ~$50–52 and breaks $60.44. This is the main reversal risk, but it is not yet confirmed.
- Bearish Rising Wedge-like rebound: The small bounce channel is rising within a larger downtrend. It is weak and likely to resolve lower.
POTENTIAL SCENARIOS
- Scenario 1: Bearish Continuation Lower — Bears stay in control, the flag/pennant resolves down, and price retests the Nov 5 low zone. Trigger: daily close below ~$56.50 with CMF staying negative. Target: $52.00–$55.00, with an extension to $50.25 (lower BB). Invalidation: close above $60.50 (the Nov 11 high). (55% probability)
- Scenario 2: Bullish Relief Rally / Double Bottom — Oversold bounce as MACD crosses up and shorts cover, driving price toward the falling EMA21. Trigger: close above $60.50 with rising volume and a MACD bullish cross. Target: $63.00–$65.50 (EMA21 to SMA200D). Invalidation: close back below $55.00. (30% probability)
- Scenario 3: Neutral Choppy Consolidation — Price chops between $52 and $60 as volatility compresses after capitulation, with the 20-day end near the current level. Trigger: failure to break either $56.50 or $60.50. Target: $56–$59. Invalidation: close outside $52–$61. (15% probability)
PRICE TARGETS
For the 20-day timeframe (Dec 5, 2026 outlook), I used a range of about 12% of the current price ($7.00 / $57.68 = 12.1%). The 14–21 day guidance is 8–12%, so this sits at the top given elevated ATR ($4.41).
- Target Price: $55.50 (20 days)
- Expected Range: $52.00 to $59.00
- Key Levels: Support at $50.25 (lower Bollinger Band; Nov 5 low zone ~$50.47), Resistance at $60.44 (recent swing high), with the next overhead resistance at the EMA21 ($63.14)
OVERALL BIAS
OVERALL BIAS: BEARISH - Price is below every key moving average, including the SMA200D, with −DI (35.8) far above +DI (19.9), ADX at 32 and CMF at -0.17 showing distribution. A bearish flag-style consolidation favors a retest of the $50–52 area. The main risk is a capitulation-driven relief bounce, since the MACD histogram is narrowing.
This is educational analysis and not financial advice.