TQQQ 4-day bullish forecast — Nov 1, 2026
- Bias: Bullish
- Timeframe: 4 days (made Nov 1, 2026, target date Nov 4, 2026)
- Price at analysis: $62.02
- Price target: $63.30
- Expected range: $60.50 – $64.60
- Result: Correct (0.0%) — closed at $62.05 on Nov 4, 2026; quality score 100/100
Get a free AI analysis of TQQQ today
Analysis
TECHNICAL INDICATORS
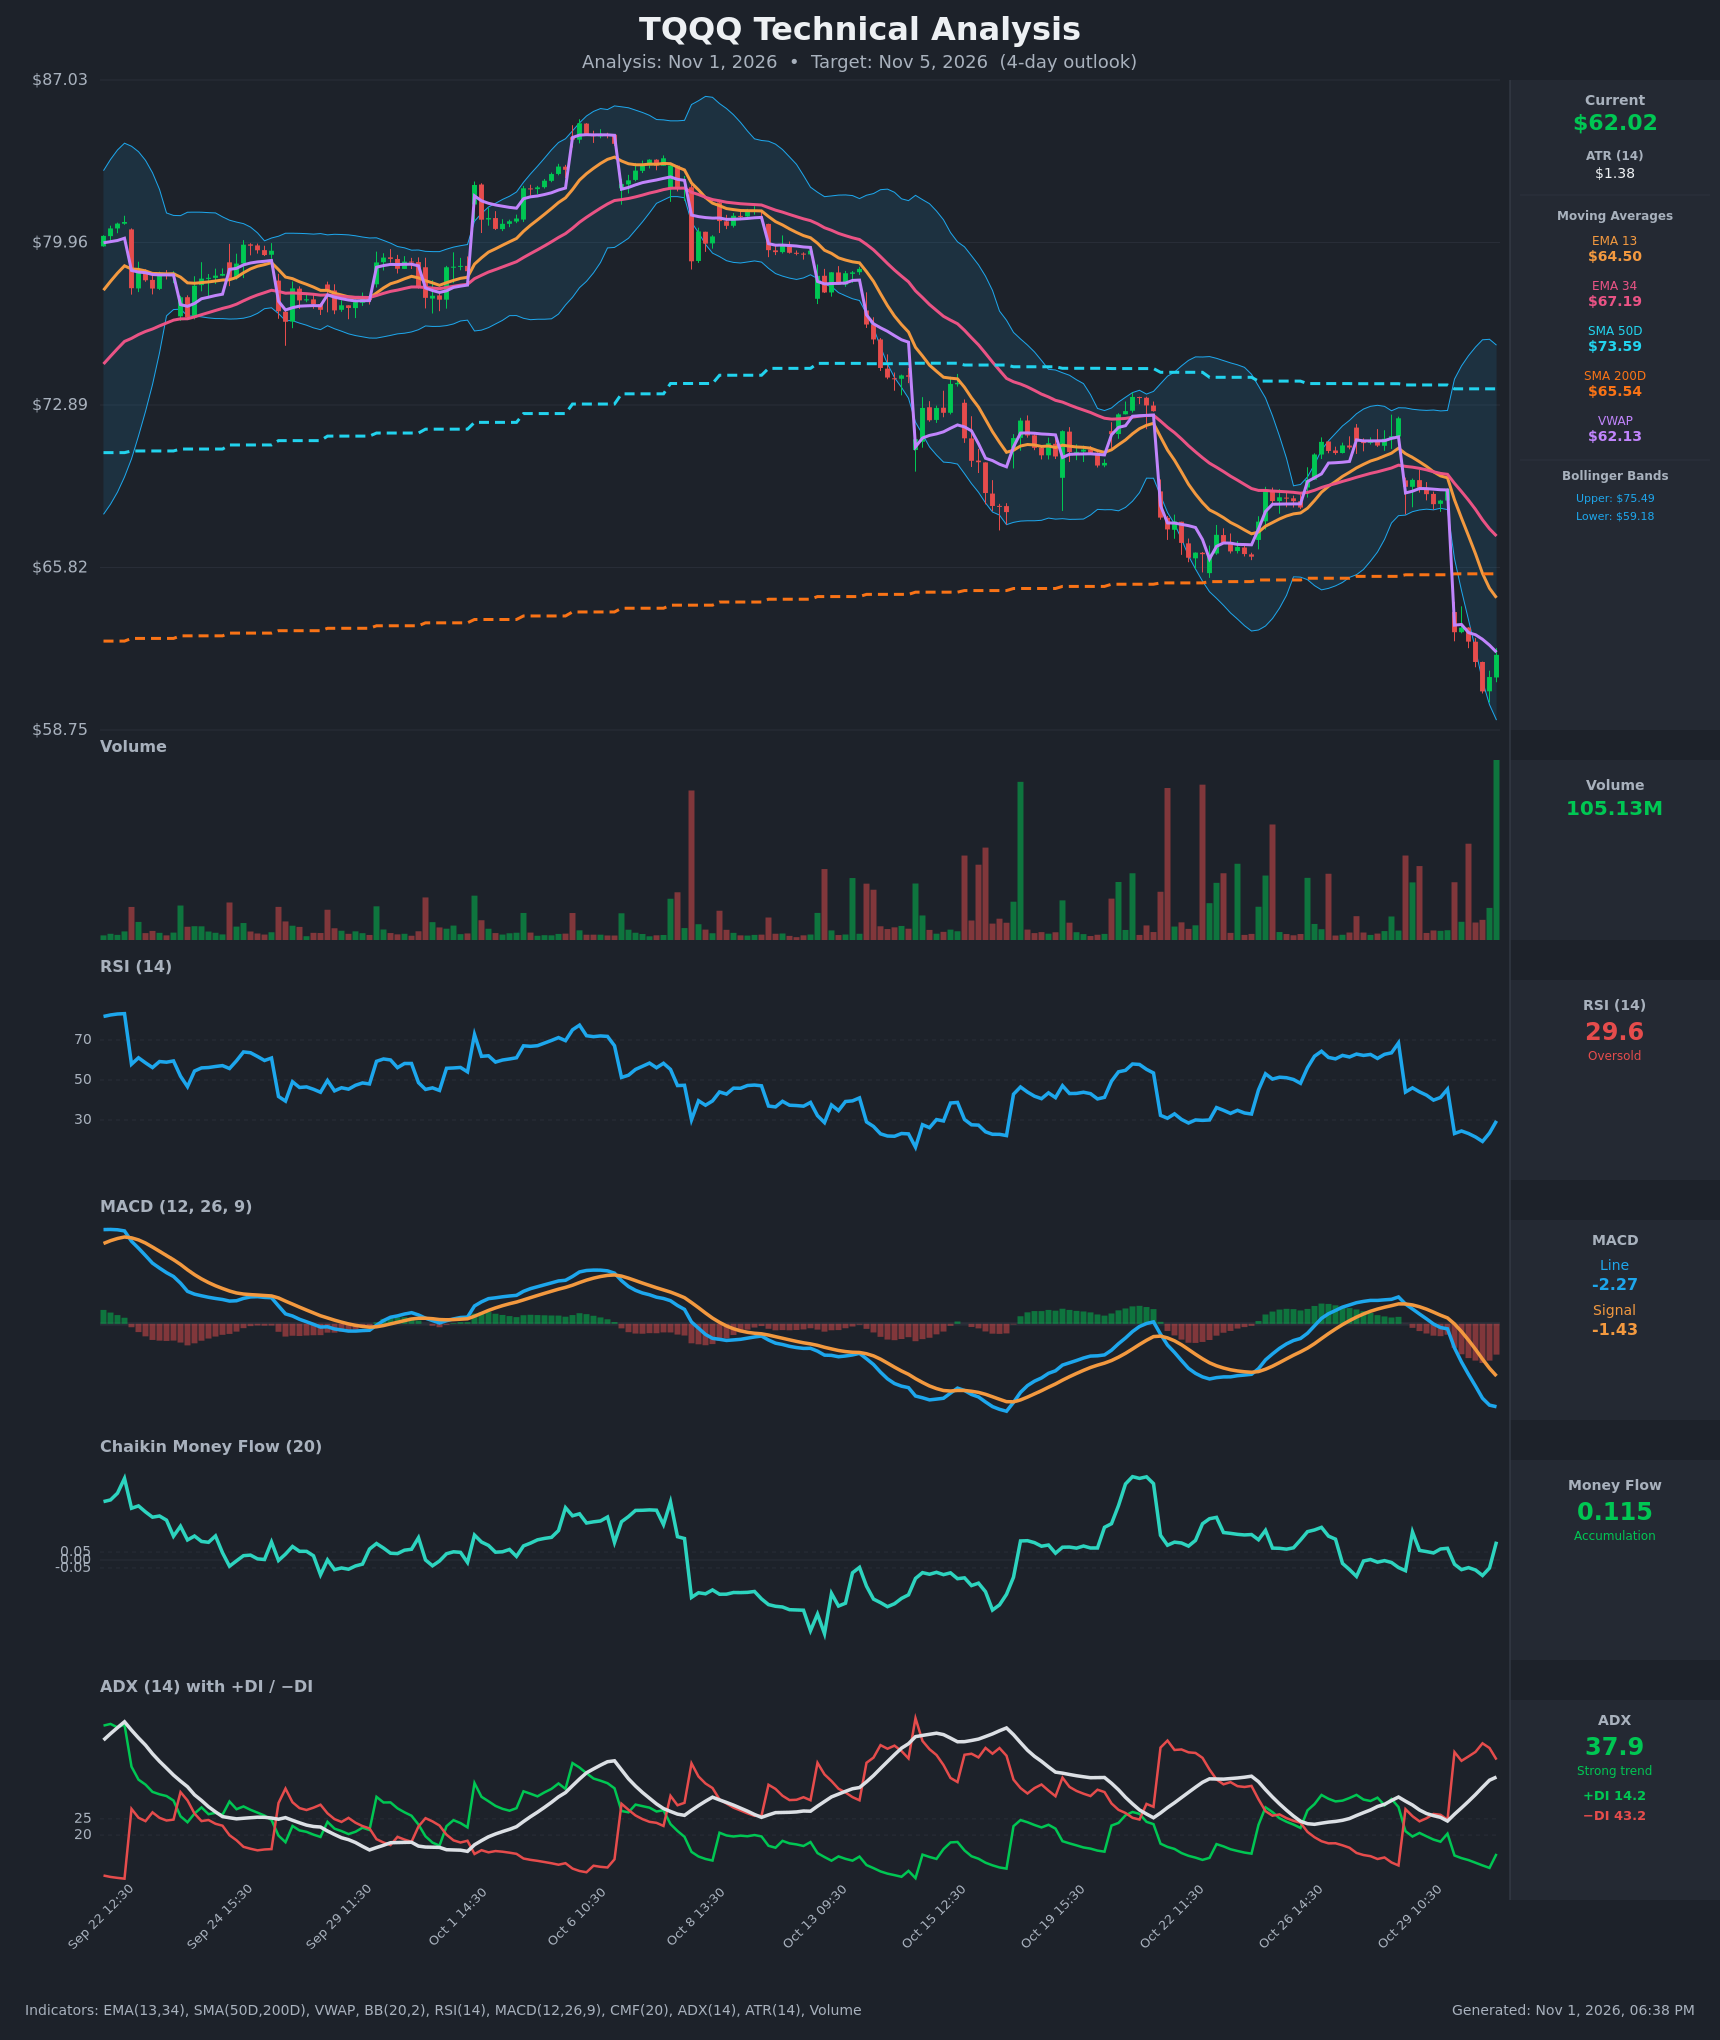
- RSI (14): 29.56, up from a low near 19 at Oct 30 13:30. It is just back above the 30 line after a washout, so momentum is turning up from deeply oversold, but it is still below 30 and well under the 50 midline. [Neutral]
- 20 EMA: The chart shows EMA 13 ($64.50) and EMA 34 ($67.19). Price at $62.02 is below both, and EMA 13 is below EMA 34 and falling fast. The EMA 13 at $64.50 is the first overhead resistance, about 4% above price. [Bearish]
- MACD: Line -2.27 is below signal -1.43, with the bearish cross on Oct 30 morning. The histogram is negative and widening, and the line is only just flattening (-2.229 to -2.274 over the last two bars). Momentum is still pointing down. [Bearish]
- Bollinger Bands (20): Upper $75.49, lower $59.18. Price is in the bottom 15% of the band after pressing the lower band on the Oct 30 flush, and the bands are wide, which fits an extended move. The last bar closed back off the lows, which suggests a stretched, bounce-prone condition. [Neutral]
- CMF (20): +0.115, up from -0.097 and now above the +0.05 accumulation threshold. This is the first notable positive reading after the breakdown and suggests dip buying near the lows. [Accumulation]
- ADX (14): 37.9 and rising, so the trend is strong. −DI (43.2) is far above +DI (14.2), though +DI ticked up from 9.9. The prevailing trend is firmly down, even though the gap may be narrowing. [Strong Trend – Bearish]
- Volume: 105.13M on the latest bar, the largest in the visible window, and it is a green bar closing at the high of the range. Heavy volume on an up bar after a steep drop is a possible capitulation or absorption signal, but it needs follow-through. [Potential capitulation / Bullish-leaning]
Other moving averages and VWAP:
- Price is below SMA200D ($65.54), a long-term support level that was lost on the Oct 30 gap.
- Price is below SMA50D ($73.59).
- Price is essentially at VWAP ($62.13), a pivot for the next session.
DIVERGENCES & TRENDS
- Divergences: There is no clean RSI/price divergence, because RSI made a new low (~19) at the same time as price. However, CMF has turned positive while price is near its lows, an early money-flow divergence against the price trend.
- Trend: Since the Oct 6 peak (~$85), the market has made lower highs and lower lows. EMA 13 is below EMA 34, both are below SMA200D, and SMA50D is far above everything.
- Crossovers and breaks:
- MACD bearish cross on Oct 30 and a −DI surge.
- The $65.5 SMA200D and the $65 consolidation floor broke on a gap.
- SMA50D and SMA200D have not formed a death cross yet, but SMA50D is well above SMA200D, so that is not a driver for this horizon.
- Latest bar: RSI and CMF are both ticking up from extremes, a classic relief-bounce setup inside a downtrend.
CHART PATTERNS
- There is no clean textbook reversal pattern yet.
- The Oct 22–29 consolidation under the EMAs resembled a Bearish Flag / Bearish Rising Wedge. Its breakdown with a gap lower is confirmed, and the measured move extends to roughly the current low zone ($59–60).
- The overall structure since Oct 6 is a descending channel, with a stretch below the lower Bollinger Band and a high-volume reversal bar.
- A Bullish Double Bottom is possible only if price retests ~$59.5–60 and holds. That is not yet formed.
- Bounce targets are the gap-fill and resistance cluster at $64.50 (EMA 13) and $65.54 (SMA200D). A failure there would resume the downtrend with $59.18 as the first target.
POTENTIAL SCENARIOS
- Scenario 1: Bullish Oversold Relief Bounce — RSI turning up from <30, positive CMF and a heavy-volume green reversal bar favor a mean-reversion bounce toward the EMA 13 area. The bounce would likely stall under the declining EMAs and the gap. Trigger: hold above $60.50 and a close above VWAP/$62.13, then above $63.50. Target: $63.30–$64.50. Invalidation: close below $60.00. (50% probability)
- Scenario 2: Bearish Trend Continuation — ADX 37.9 with −DI dominant, MACD still diverging lower and price below all key averages suggest the bounce could fail and the downtrend resume. Trigger: rejection at $63–64 or loss of VWAP/$61.50. Target: $59.18 (lower BB), then ~$58. Invalidation: close above $65.54 (SMA200D). (40% probability)
- Scenario 3: Neutral Choppy Basing — Price consolidates between $60 and $64 as the market digests the gap. Trigger: low-volume inside days around VWAP. Target: ~$62. Invalidation: close outside $59.50–$64.50. (10% probability)
PRICE TARGETS
For 4 days (Nov 5, 2026), ATR of $1.38 implies a typical ±$2.8 move over 4 days. The range width is $4.10, which is 6.6% of the current price and appropriate for a 4-day horizon.
- Target Price: $63.30
- Expected Range: $60.50 to $64.60
- Key Levels: Support at $59.18, Resistance at $64.50
OVERALL BIAS
OVERALL BIAS: BULLISH - Modest-conviction call for an oversold relief bounce: RSI turned up from below 30, CMF flipped to accumulation, and the latest bar was a high-volume green reversal at the lower Bollinger Band. The strong downtrend (ADX 37.9, −DI dominant, MACD bearish) caps the upside near $64.50 and keeps the risk of renewed selling meaningful.
This is educational analysis and not financial advice.