TSLA 4-day bullish forecast — Nov 1, 2026
- Bias: Bullish
- Timeframe: 4 days (made Nov 1, 2026, target date Nov 4, 2026)
- Price at analysis: $399.82
- Price target: $403.50
- Expected range: $392.50 – $408.00
- Result: Incorrect (-3.7%) — closed at $385.19 on Nov 4, 2026; quality score 13/100
Get a free AI analysis of TSLA today
Analysis
TECHNICAL INDICATORS
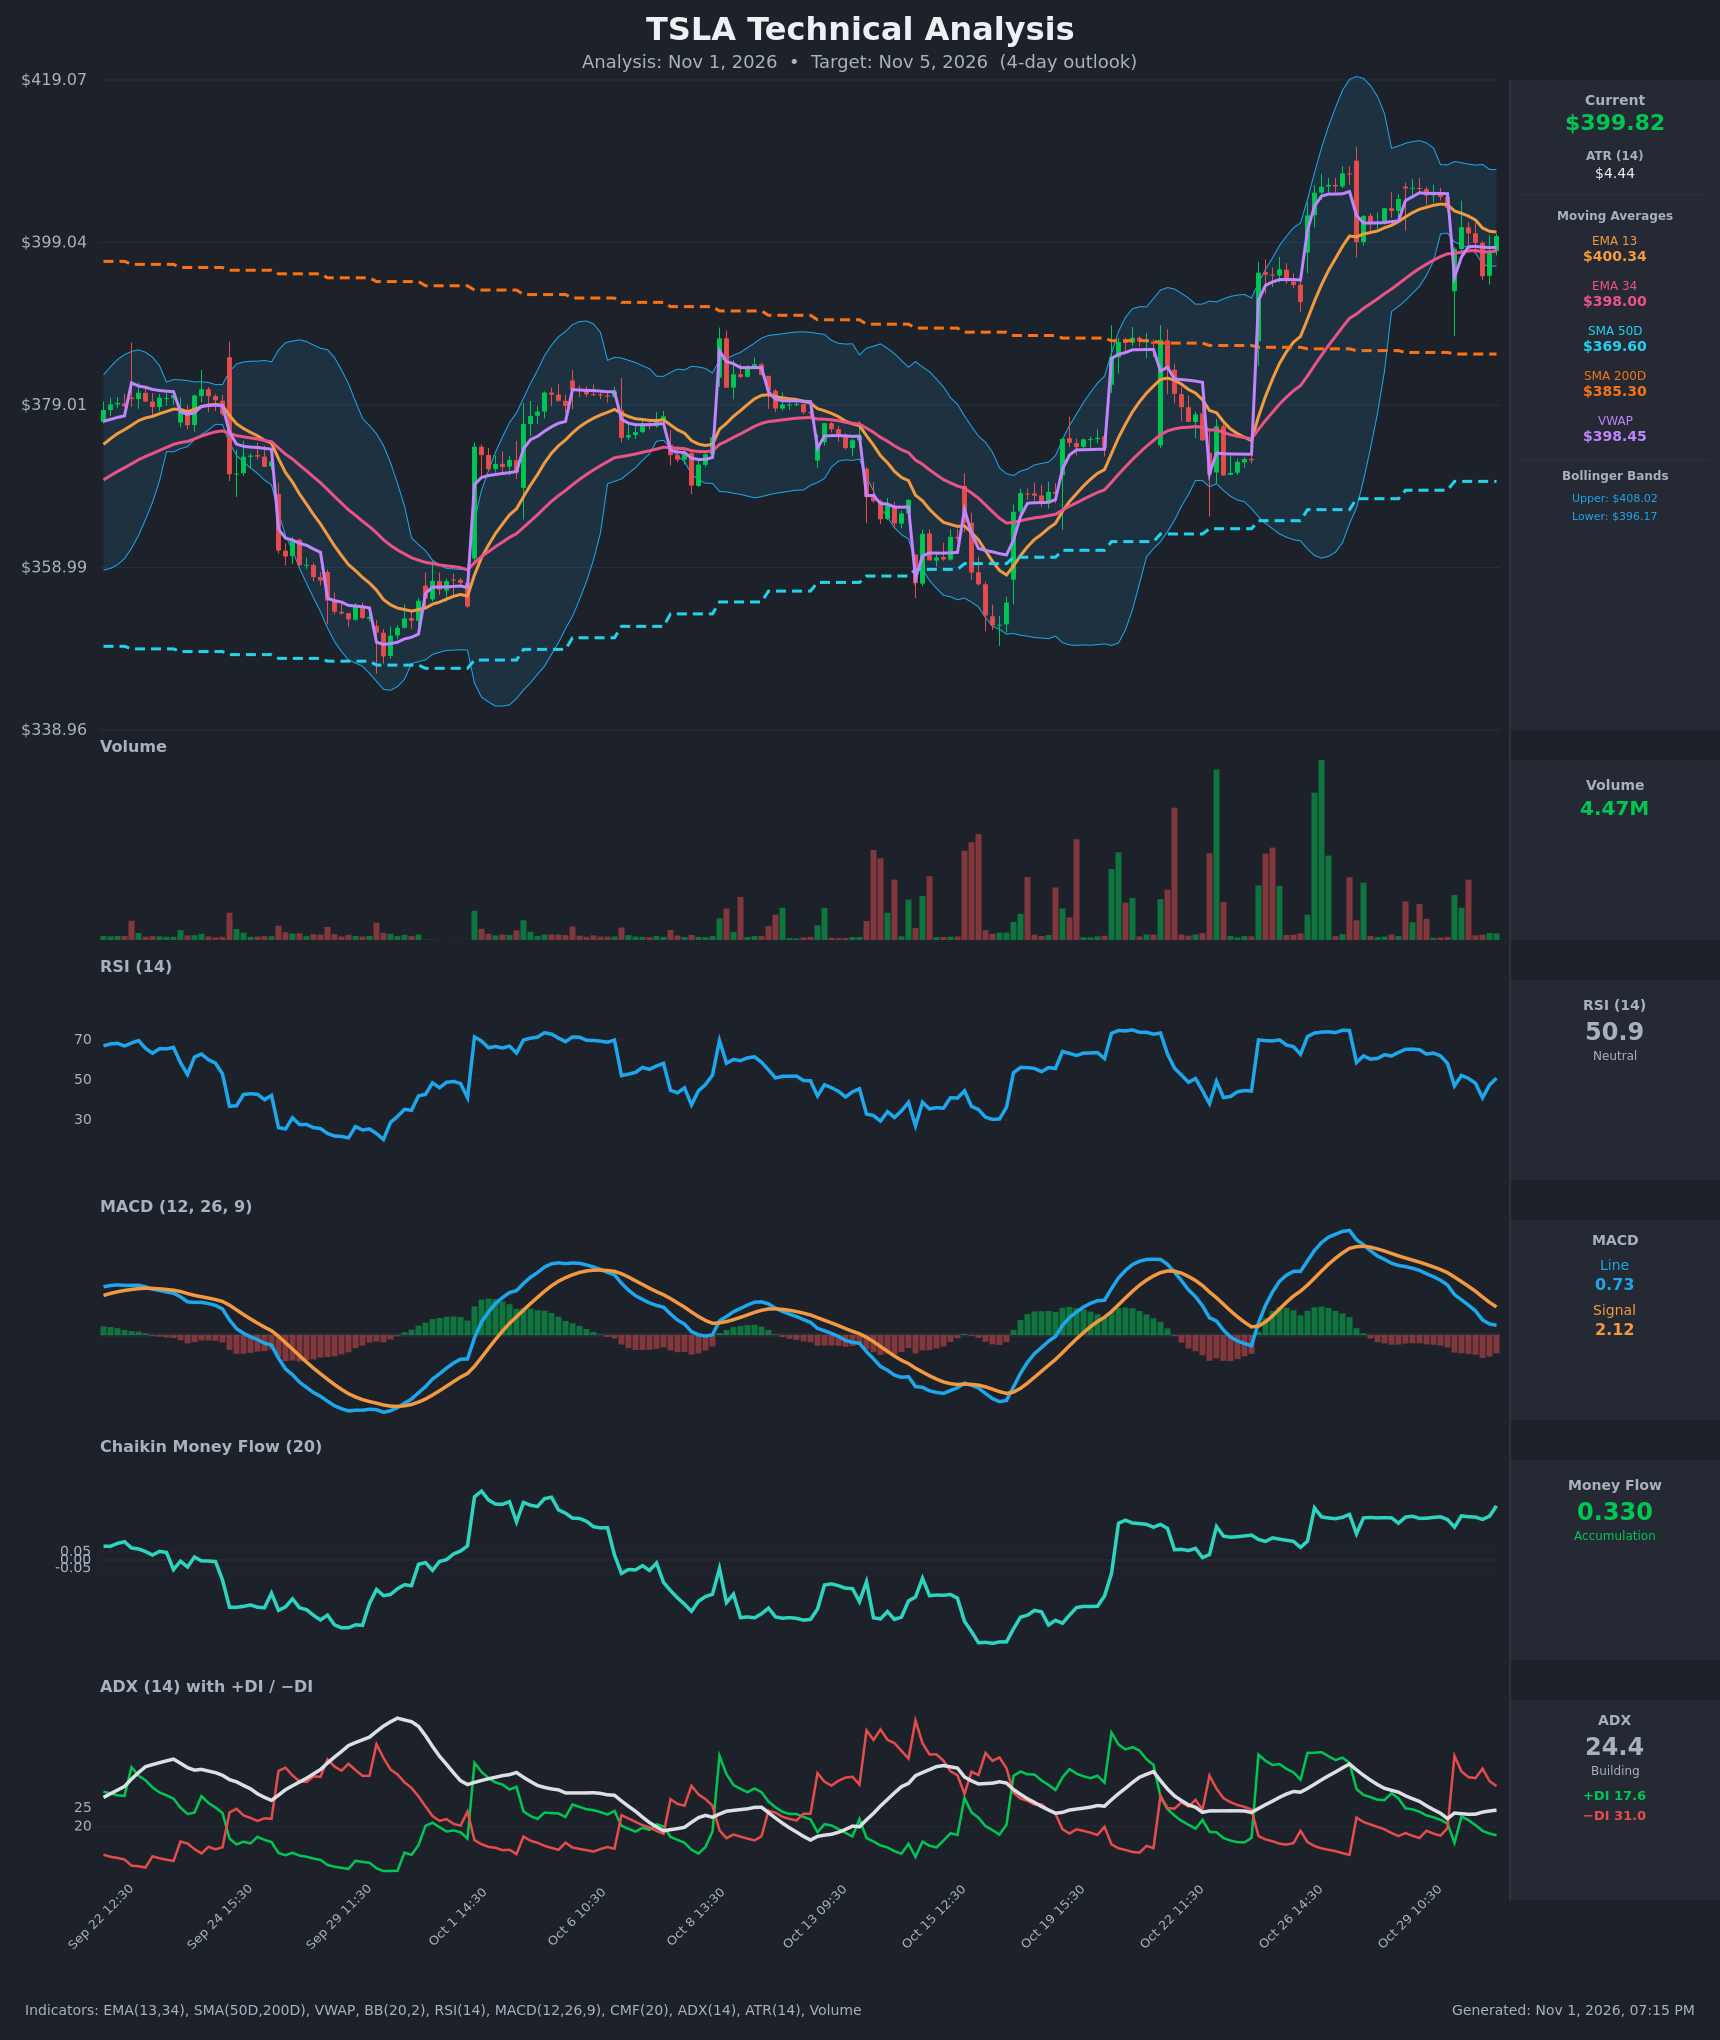
- RSI (14): 50.92, dead neutral. It fell from 65 on Oct 29 to a low of 41 on Oct 30 at 13:30, then rebounded about 10 points. Momentum has stopped falling but has not turned decisively up. [Neutral]
- 20 EMA: The supplied data gives EMA13 at $400.34 and EMA34 at $398.00. Price ($399.82) is just below EMA13, which is minor resistance, and just above EMA34, which is the first support. EMA13 is still above EMA34, so the short-term structure is intact, but the gap has shrunk from about $8 to $2.3. [Neutral]
- MACD: Line 0.73 is below Signal 2.12, a bearish crossover from Oct 29 to 30. The histogram is about -1.39 and has been narrowing in the last few bars (-1.73 to -1.39), so downside momentum is fading but not reversed. [Bearish]
- Bollinger Bands (20): Upper $408.02, lower $396.17, midline about $402.1. Price sits in the lower half of the bands (%B about 0.31). The Oct 30 selloff reached the lower band and bounced. Bands have narrowed from the earlier expansion, which points to consolidation. [Neutral]
- CMF (20): 0.330, well above +0.05 and rising on the last bar (0.247 to 0.330). Buying pressure has held through the pullback, and the CMF line is not confirming the price weakness. [Accumulation]
- ADX (14): 24.4, just under 25 and building. −DI (31.0) is well above +DI (17.6), so sellers have directional control. The DI crossover on Oct 30 is bearish, but ADX below 25 means the trend is not strongly established. [Weak/Moderate Trend, bearish DI]
- Volume: 4.47M, with recent bars lighter than the spike days of Oct 22 to 26. The pullback came on modest volume, which looks more like digestion than aggressive distribution. [Neutral to mildly Bullish]
Other levels: price is above VWAP ($398.45), SMA50D ($369.60) and SMA200D ($385.30), so the longer-term uptrend is intact. The SMA50D is below the SMA200D, but the gap is narrowing and a golden cross has not occurred.
DIVERGENCES & TRENDS
- CMF vs price: Price fell from about $405.8 to $399.8, but CMF held at 0.25-0.33 and made a fresh recent high on the last bar. This is a bullish divergence in money flow.
- MACD: The bearish crossover is confirmed, but the histogram is shrinking. This is typical of a pullback losing steam, not a trend reversal.
- DI: The −DI spike to 39 on the Oct 30 gap down has cooled to 31, while +DI is recovering from 15.5 to 17.6. The bearish control is fading, and a DI crossover back up is not yet present.
- RSI: It rebounded from 41 to 51 while price recovered from $394.89 to $399.82 (higher lows intraday). Momentum is stabilizing.
- Crossovers: EMA13 is above EMA34 with no crossover, though the spread is compressing. There is no golden cross or death cross. VWAP is acting as support.
- Price action: The Oct 30 low at $394.89 was rejected quickly, leaving a long lower wick that shows dip-buying.
CHART PATTERNS
- Bullish Flag Pattern (primary): A sharp rally from about $370 to $410 (Oct 22-28) is followed by a shallow, slightly downward-drifting pullback, with price holding above EMA34 and VWAP. A break above $405-406 would activate the flag. The measured-move target is far beyond a 4-day window, but an initial thrust toward $408-410 is plausible.
- Minor double top (secondary, bearish risk): Peaks near $405.8 (Oct 29) and about $410 (Oct 28) form a possible Bearish Double Top. A close below the Oct 30 low (~$394.9) would confirm it, with downside toward $388-390.
- Compression: Narrowing Bollinger Bands and an ADX below 25 indicate a consolidation phase before the next directional move.
POTENTIAL SCENARIOS
- Scenario 1: Bullish Flag Resolution — Price holds the EMA34/VWAP zone, reclaims EMA13, and rallies toward the upper Bollinger Band as CMF accumulation pays off and the MACD histogram turns positive. Trigger: hourly close above $401 followed by a break of $405.80. Target: $405-408. Invalidation: close below $396 (BB lower and the Oct 30 wick area). (45% probability)
- Scenario 2: Bearish Continuation Pullback — −DI dominance and the negative MACD drive a retest of the lower band and the Oct 30 low, possibly confirming the minor double top. Trigger: loss of EMA34/VWAP ($398) and a break of $394.90. Target: $390-393. Invalidation: reclaim of $402 on rising volume. (35% probability)
- Scenario 3: Neutral Range Chop — Price oscillates between $396 and $404 as the ADX stays below 25 and the bands keep narrowing. Trigger: failure to break either $396.17 or $405.80. Target: $398-402. Invalidation: close outside the $394-408 range. (20% probability)
PRICE TARGETS
For a 4-day horizon with ATR of $4.44, a one-sigma 4-day move is about $8-9, so a range of about 3.9% of the current price fits.
- Target Price: $403.50 (4-day target)
- Expected Range: $392.50 to $408.00 (width $15.50, about 3.9% of current price)
- Key Levels: Support at $396.17, Resistance at $405.80
OVERALL BIAS
OVERALL BIAS: BULLISH - Conviction is modest. Strong, rising CMF accumulation, price above VWAP, EMA34 and all SMAs, a quick rejection of the $394.89 low, and a fading MACD histogram outweigh the bearish MACD cross and −DI dominance. Because the ADX is below 25, a break below $394.90 would flip the bias.
This is educational analysis and not financial advice.