TSLA 62-day bullish forecast — Nov 15, 2026
- Bias: Bullish
- Timeframe: 62 days (made Nov 15, 2026, target date Jan 15, 2027)
- Price at analysis: $390.22
- Price target: $412.00
- Expected range: $352.00 – $438.00
- Result: Pending — graded after the close on Jan 15, 2027
Get a free AI analysis of TSLA today
Analysis
TECHNICAL INDICATORS
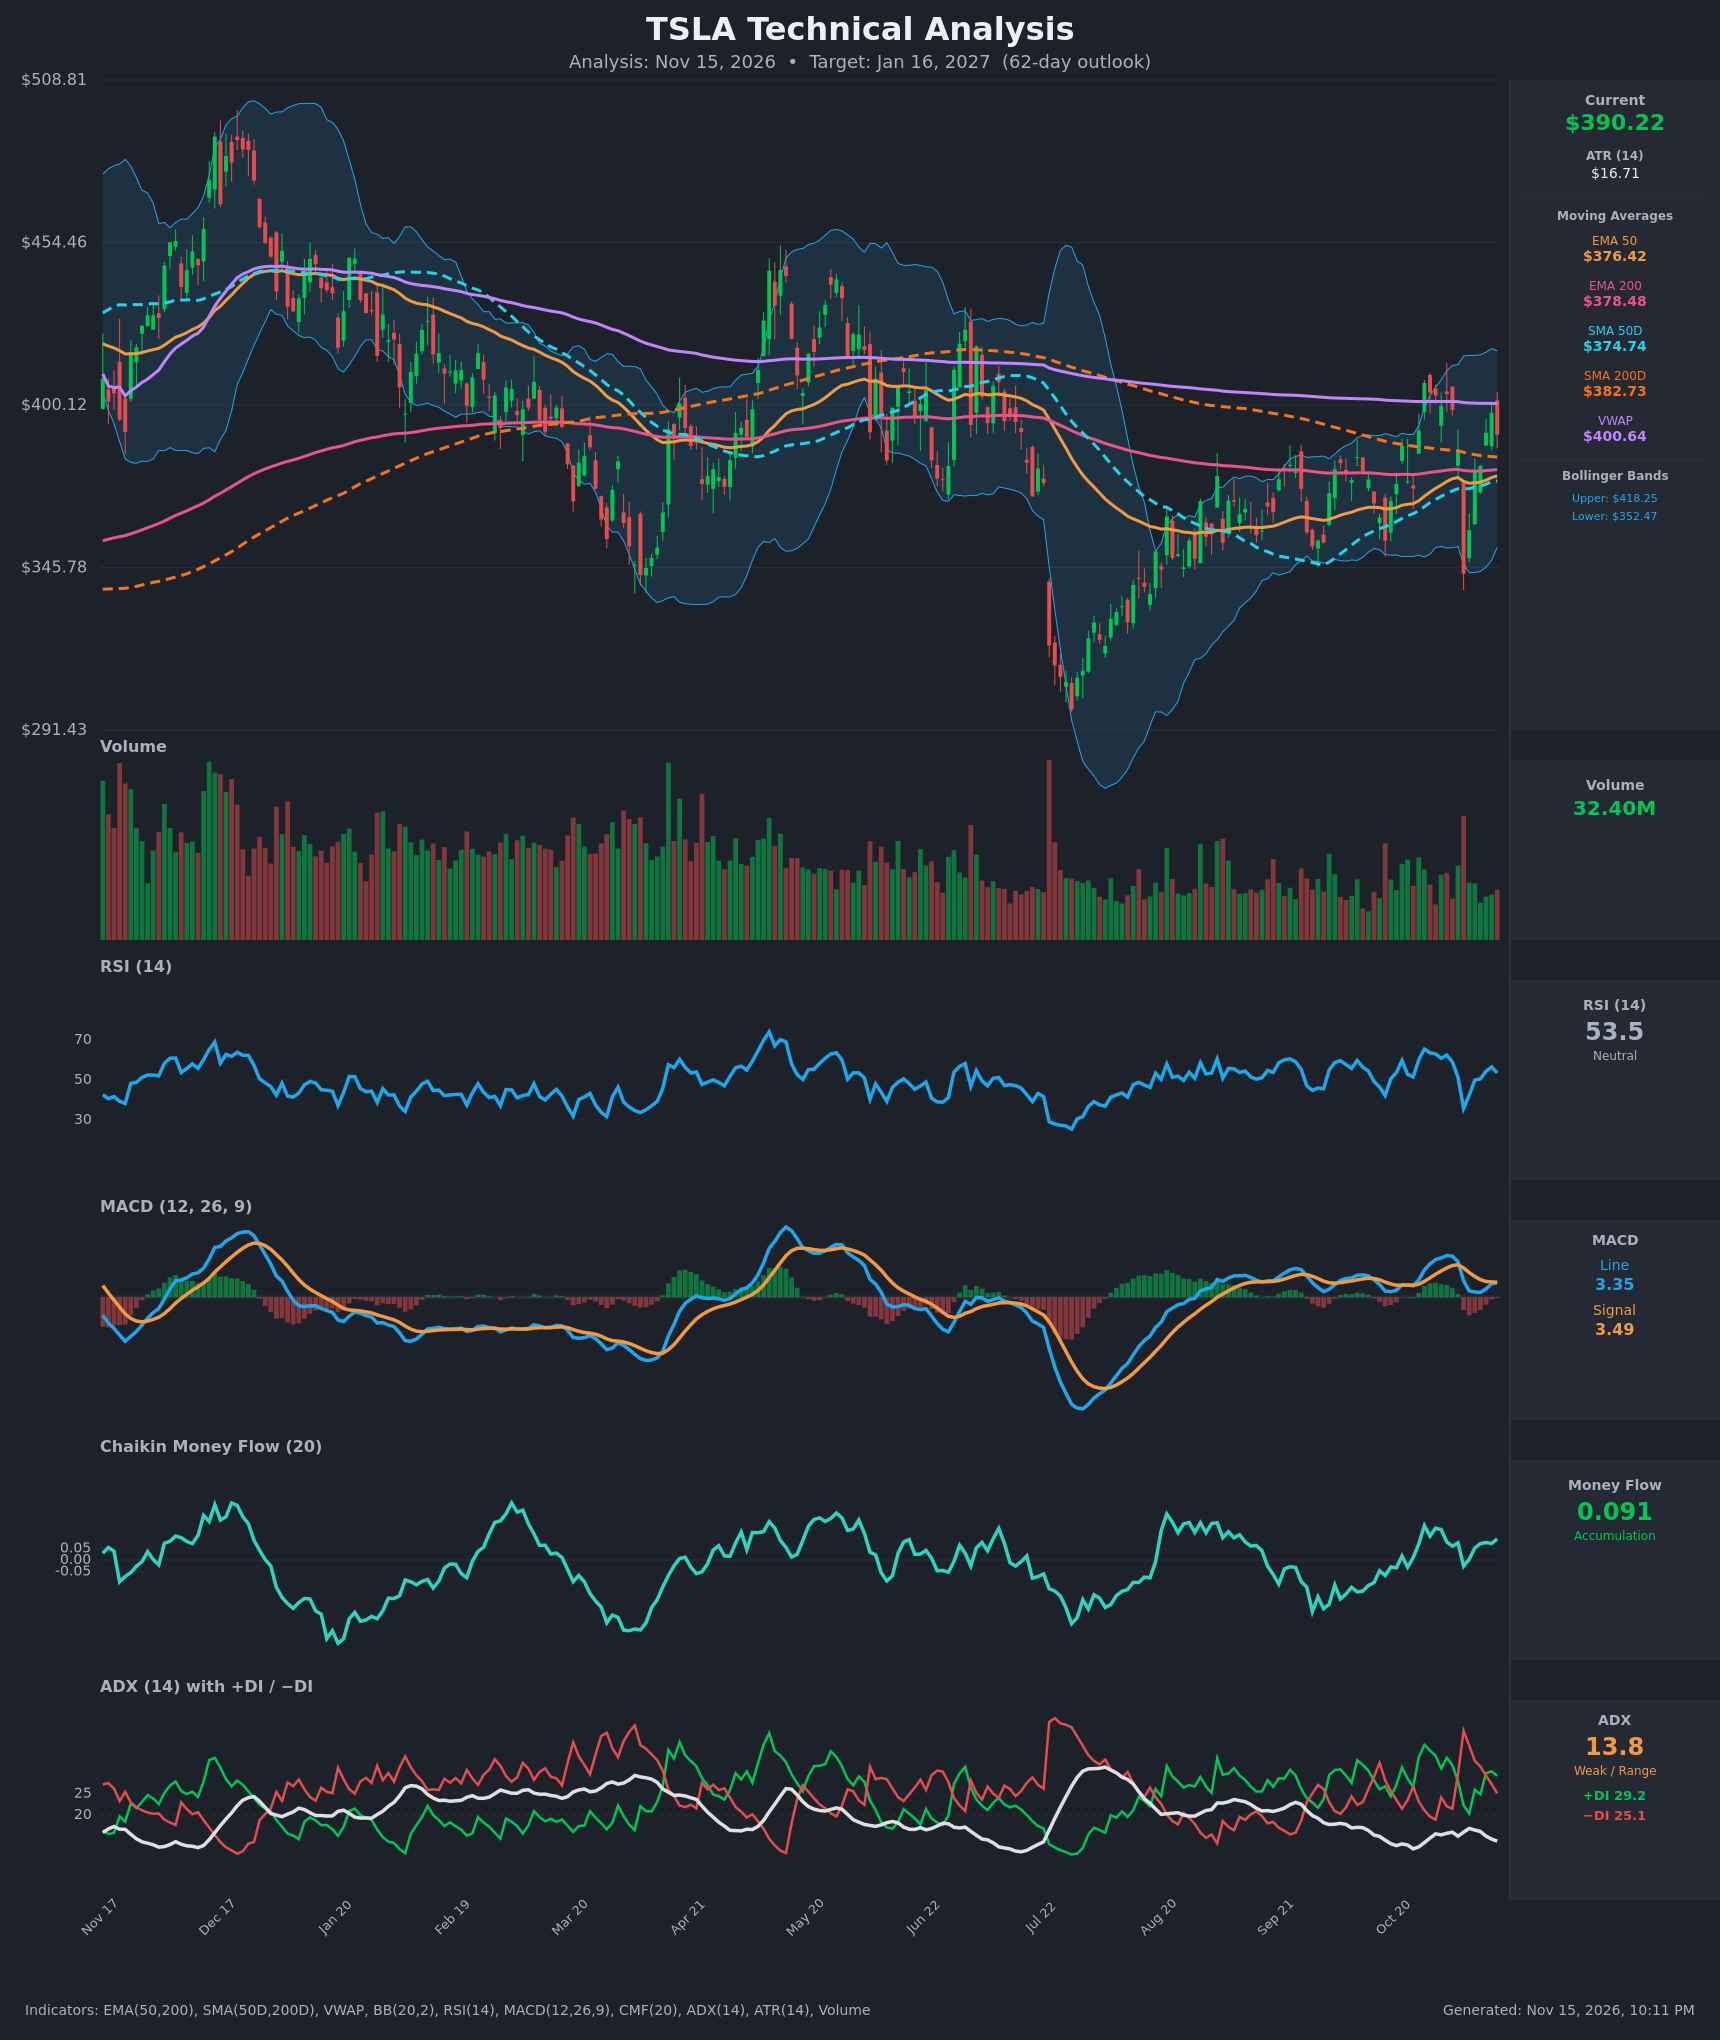
- RSI (14): 53.5, mid-range. It has recovered from 35.8 on Nov 5 and sits below the 65 peak of Oct 27. Momentum is neutral to slightly positive, with room to run before overbought. [Neutral]
- 20 EMA: Not supplied, so I use the EMA 50 ($376.42) as the nearest guide. Price at $390.22 is about 3.7% above it, and the EMA 50 is rising again after dipping to $373.94. EMA 50 is still just below EMA 200 ($378.48), so the gap is narrowing but no bullish crossover has occurred. [Bullish]
- MACD: Line 3.349 versus signal 3.486, so the histogram is marginally negative at about -0.14. The line has bottomed (1.12 on Nov 10) and climbed back toward the signal line. It is a tiny bearish gap inside a recovering momentum structure. [Neutral]
- Bollinger Bands (20): Upper $418.25, lower $352.47, midline about $385. Price sits slightly above the midline, with the Nov 5 wick having tagged the lower band. Bandwidth is moderate, so there is no squeeze and no extreme reading. [Neutral]
- CMF (20): 0.091, above the +0.05 threshold. It has been positive on most recent bars and the only dip below zero was on Nov 5, which recovered quickly. This points to modest accumulation. [Accumulation]
- ADX (14): 13.8 and drifting lower, which signals a weak, range-bound market. +DI (29.2) is above −DI (25.1), but the spread has narrowed from 33.6/23.1 on Oct 26. Bulls have a slight edge without trend conviction. [Weak Trend, slight bullish tilt]
- Volume: 32.40M, below the spike seen on the Nov 5 sell-off day and in line with the quiet volume of recent weeks. The sharp Nov 5 drop was absorbed and fully retraced within about six sessions, which is constructive. [Neutral to mildly Bullish]
DIVERGENCES & TRENDS
- Moving-average structure: Price ($390.22) is above EMA 50, EMA 200, SMA 50D ($374.74) and SMA 200D ($382.73), so it has reclaimed the long-term average. The MAs are compressing, with SMA 50D at $374.74 versus SMA 200D at $382.73 (gap about $8) and EMA 50 versus EMA 200 about $2. A golden cross could occur within the 62-day window if price holds, but neither cross has happened yet.
- VWAP: Price is about $10 below the $400.64 VWAP, which acts as near-term overhead resistance.
- Price/indicator relationship: No clear divergence. Price made a higher low on Nov 5 ($343.69) compared with the July low near $291. RSI and CMF both recovered quickly.
- Momentum: The MACD histogram flipped slightly negative on Nov 13 after peaking Nov 3 to Nov 5. This is a minor pause rather than a trend change.
- ADX trend: ADX has been below 20 for months, so moves have been mean-reverting inside a wide $345–$420 range. Breakouts need confirmation.
CHART PATTERNS
- Bullish Falling Wedge / base (reversal) since July: Higher lows since the $291 trough, with price pushing up through the now-converging moving averages. This is a loose basing structure, not a textbook pattern.
- Triple Top / range structure (caution): Repeated rejections near $415–$420 (the Oct high, the Bollinger upper band area, and the earlier May and Jun highs near $420–$430) form a ceiling. A clean break above $420 would open a measured move toward roughly $440–$455. Failure there keeps price in the range.
- Nov 5 flush and recovery: A one-day wick to $343.69 that was fully retraced is a sign of buyers defending the $345–$355 zone (the lower Bollinger band region). That is a loose Bullish Double Bottom with the Aug–Oct lows near $345–$350.
POTENTIAL SCENARIOS
- Scenario 1: Bullish Range Breakout — Price holds above the SMA 200D and EMA cluster, reclaims VWAP, and attacks the $418–$420 ceiling as MAs converge toward a golden cross. Trigger: daily close above $400.64 (VWAP) followed by a close above $420 with MACD crossing above signal. Target: $412 as the base case at 62 days, with an extension to $435–$450 on a confirmed breakout. Invalidation: daily close below $374 (SMA 50D / EMA 50). (45% probability)
- Scenario 2: Neutral Range Consolidation — With ADX under 15, price oscillates between about $355 and $418 and ends the period near the current level. Trigger: repeated rejections at VWAP/$418 and bounces at $375. Target: $380–$400. Invalidation: a close above $420 or below $350. (30% probability)
- Scenario 3: Bearish Breakdown — Failure at VWAP and loss of the converged MA cluster triggers a retest of the lower band and the Nov 5 low. Trigger: daily close below $374 with −DI crossing back above +DI and CMF below -0.05. Target: $345–$355, with a stretch toward $330. Invalidation: close back above $400. (25% probability)
PRICE TARGETS
- Target Price: $412.00 (62 days, Jan 16, 2027)
- Expected Range: $352.00 to $438.00 (width $86, about 22% of the current price, consistent with the 61–180 day guidance)
- Key Levels: Support at $382.73 (SMA 200D; deeper support at $374.74 SMA 50D and $352.47 lower Bollinger band), Resistance at $400.64 (VWAP; major resistance at $418–$420)
OVERALL BIAS
OVERALL BIAS: BULLISH - Price has reclaimed all major moving averages, CMF shows accumulation, +DI leads −DI, and the Nov 5 flush was fully bought back, while converging MAs raise the odds of a golden cross. Conviction is modest because ADX is weak (13.8), VWAP and the $418–$420 ceiling are overhead, and the MACD histogram is marginally negative.
This is educational analysis and not financial advice.