TSLA 34-day bullish forecast — Nov 15, 2026
- Bias: Bullish
- Timeframe: 34 days (made Nov 15, 2026, target date Dec 18, 2026)
- Price at analysis: $390.22
- Price target: $402.00
- Expected range: $362.00 – $420.00
- Result: Pending — graded after the close on Dec 18, 2026
Get a free AI analysis of TSLA today
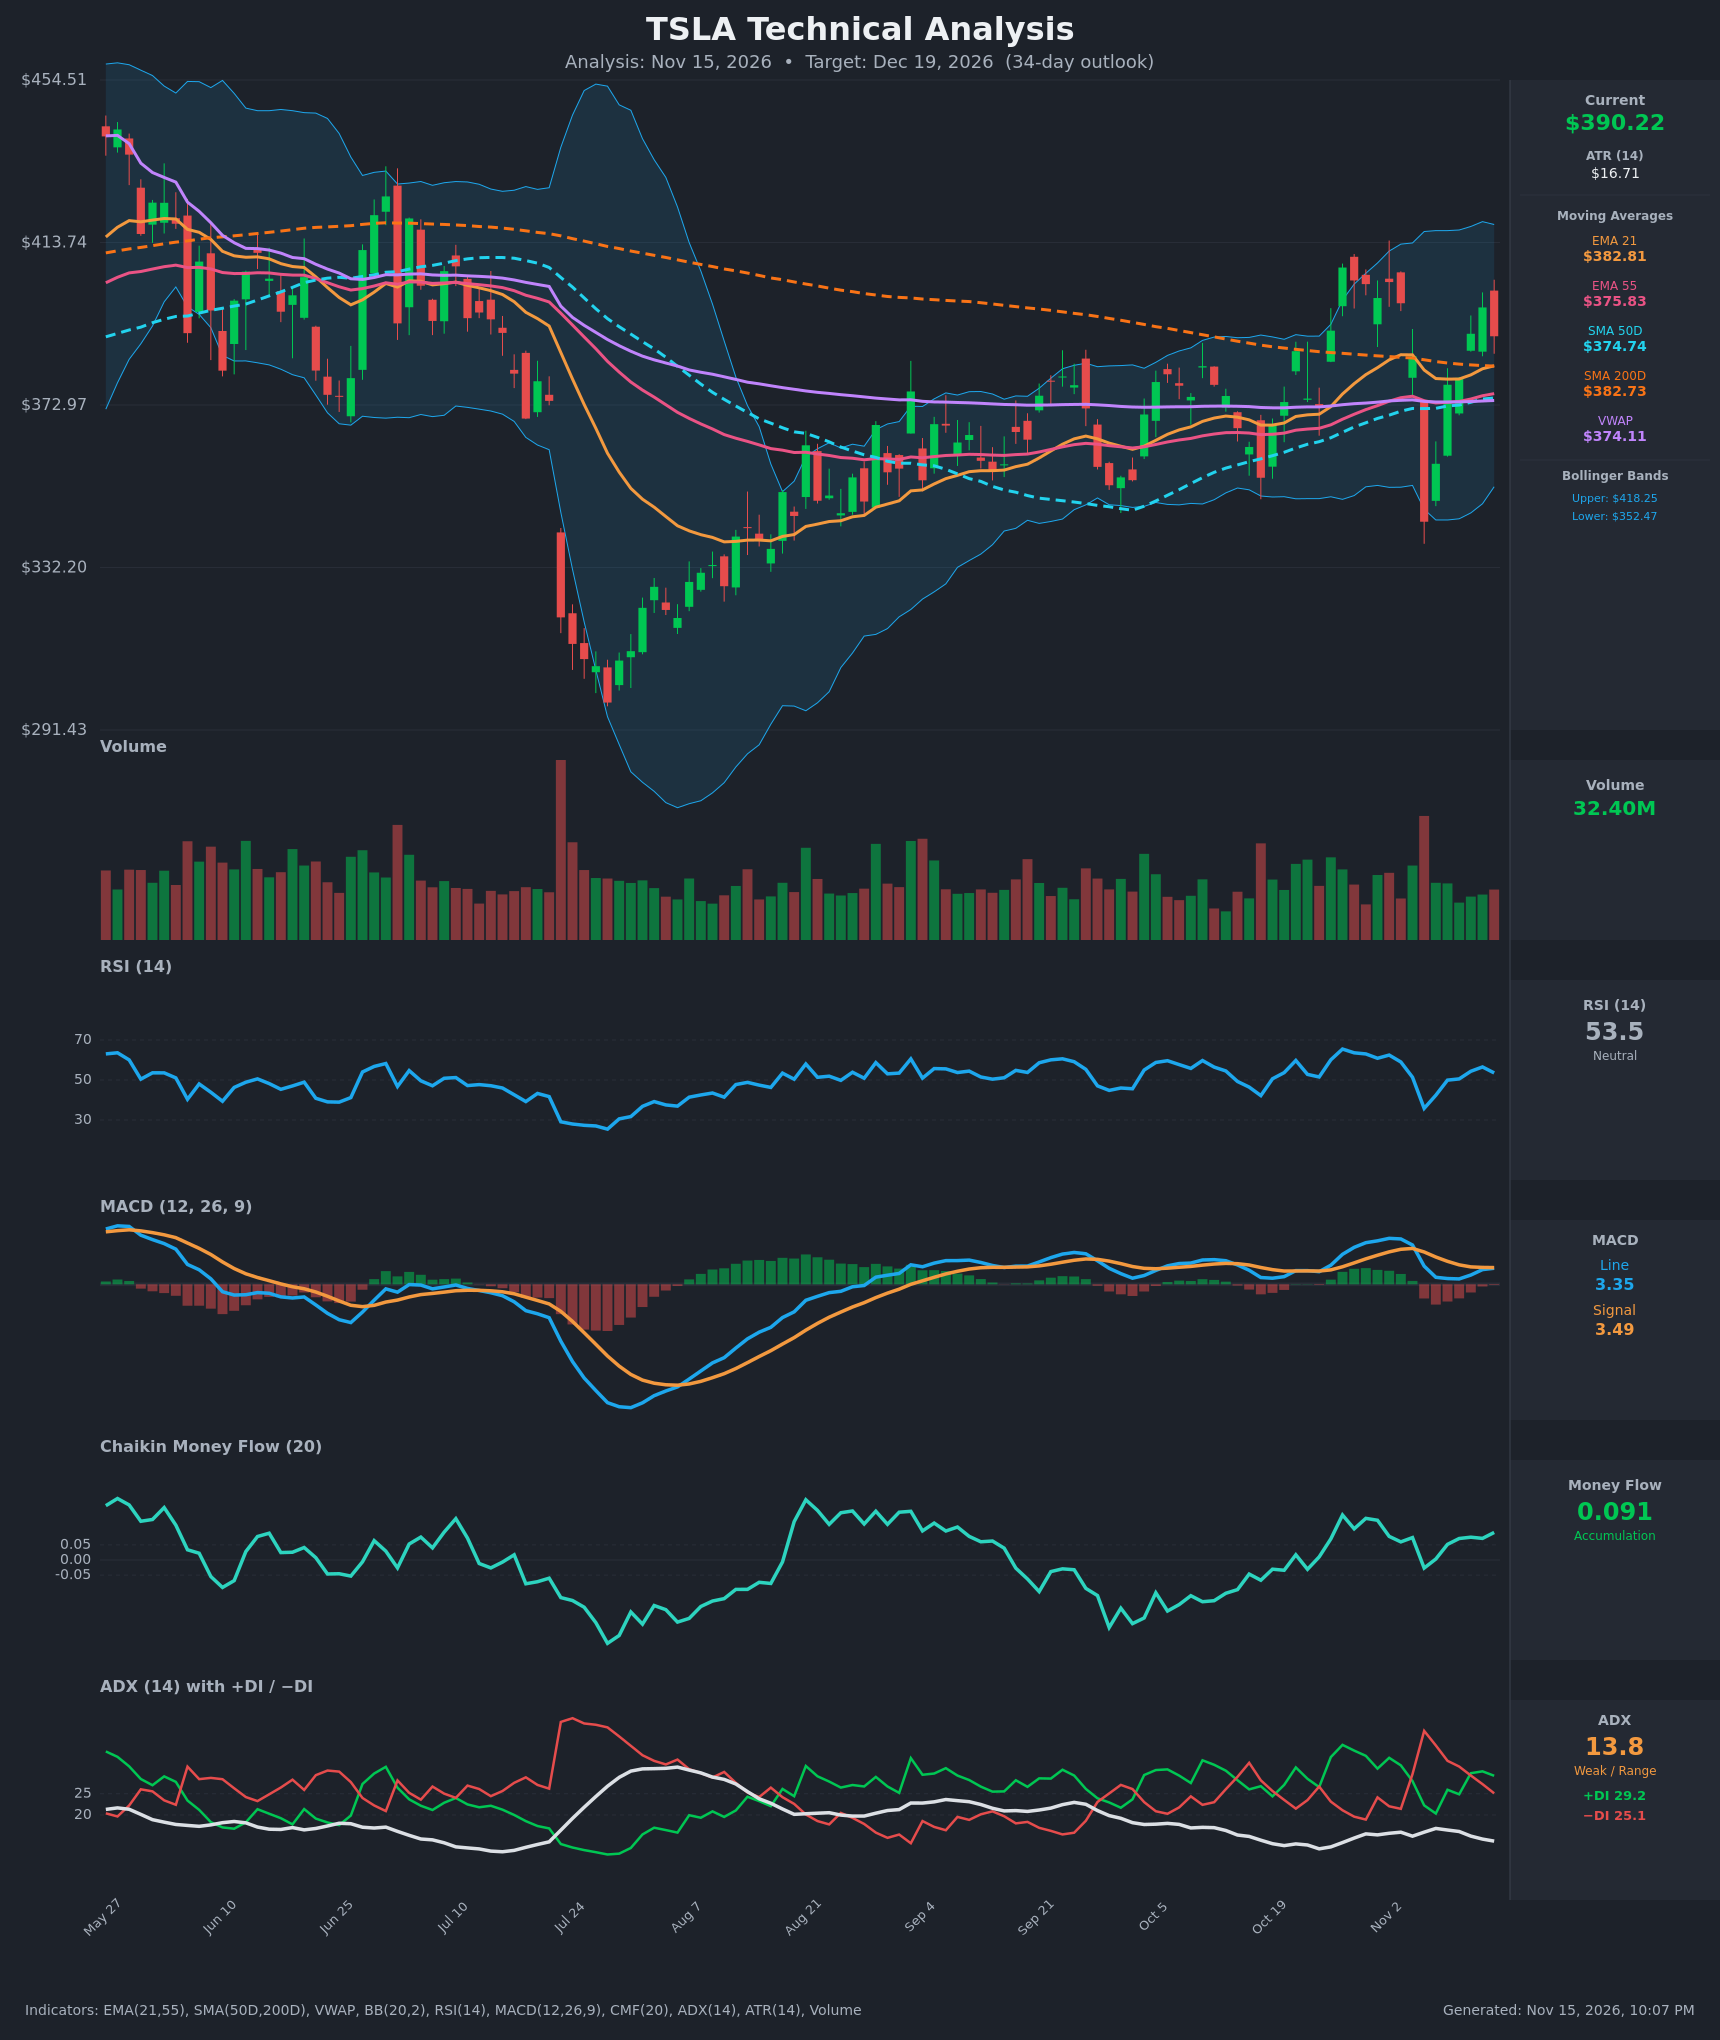
Analysis
TECHNICAL INDICATORS
- RSI (14): 53.54, mid-range and neutral. It has recovered from 35.8 on Nov 5 and has rolled over slightly from 56.5 on Nov 12. Momentum has recovered but is now flattening. [Neutral]
- 20 EMA (EMA 21): $382.81, with price ($390.22) about 1.9% above it. EMA21 is rising and sits above EMA55 ($375.83), so the short-term trend structure is intact and the EMA acts as first support. [Bullish]
- MACD: Line 3.349 versus signal 3.486, so the line sits just below the signal with a marginally negative histogram. The line has been climbing back toward the signal from 1.1 and the gap is only about 0.14, so a bullish re-cross is close. It is still positive but weak and indecisive. [Neutral]
- Bollinger Bands (20): Upper $418.25, lower $352.47, midline about $385. Price is slightly above the midline with room toward the upper band. The bands are moderately wide after the Nov 5 flush to $343.69, and the lower band is now curling upward. [Neutral]
- CMF (20): 0.091, above the +0.05 threshold and positive for the last several sessions (0.05–0.09 range). That points to quiet accumulation even through the sell-off. [Accumulation]
- ADX (14): 13.8 and declining, which means no real trend. +DI (29.2) is above −DI (25.1), a mild bullish edge, but the spread has narrowed from Nov 12 and the market is range-like. [Weak Trend, mild bullish lean]
- Volume: 32.40M, roughly average to below average on the recent rebound. The Nov 5 capitulation bar was a high-volume spike, and the recovery since has come on lighter volume. That is not a strong confirmation, but there has been no heavy distribution either. [Neutral to mildly supportive]
DIVERGENCES & TRENDS
- Moving averages: Price is above EMA21, EMA55, SMA50 ($374.74), VWAP ($374.11) and SMA200 ($382.73). Price is only about 2% above SMA200, which is flat to slightly declining and acting as a pivot.
- SMA50 vs SMA200: SMA50 is still below SMA200 (no golden cross), but the gap has narrowed from about $21 on Oct 26 to about $8. A golden cross is possible in the coming weeks if price holds.
- EMA crossover: EMA21 is above EMA55 with a stable spread, a bullish alignment.
- MACD: It crossed below the signal on Nov 5 and is converging again, with no clear divergence from price.
- Price/indicator relationship: CMF has held positive through the Nov 5 drop, a mild bullish divergence. RSI higher low (35.8 versus the earlier lows near 27) confirms the sell-off was absorbed.
- DI lines: −DI crossed above +DI on Nov 4–6, then +DI retook the lead on Nov 9. The spread is narrowing again.
- Failed breakdown: The Nov 5 drop to $343.69 (a long lower wick) was recovered within four sessions, which is a short-term bullish reversal signal.
CHART PATTERNS
- Broad range (similar to the Bullish Triple Top/rectangle in the reference): Since mid-August, price has oscillated between roughly $345 support and $405–$410 resistance. A confirmed close above about $410 would project toward $440–$455 (the measured move of the range, roughly the Jul–Aug highs).
- Failed breakdown/recovery: The Nov 5 flush and V-shaped recovery resemble a spring or shakeout inside the range, which is mildly bullish.
- Moving-average cluster: EMA55, SMA50 and VWAP at $374–$376 form a support band, with SMA200 and EMA21 at about $383 just overhead of that band.
- Caveat: ADX at 13.8 means breakouts have a low base rate of follow-through until the trend strengthens. A decisive break needs volume.
POTENTIAL SCENARIOS
- Scenario 1: Bullish Range Breakout Attempt — Accumulation (CMF > 0.05) and the +DI lead carry price above the Oct 27 high zone and toward the upper Bollinger Band. A MACD re-cross above signal would support this. Trigger: daily close above $408–$410 with volume above about 40M, plus a MACD bullish cross. Target: $418–$430, with an extension to about $440. Invalidation: daily close below $374 (EMA55/SMA50/VWAP cluster). (45% probability)
- Scenario 2: Neutral Range Chop — ADX stays below 20 and price oscillates around the SMA200/EMA21 pivot between the moving-average support and the $405–$410 resistance. Trigger: repeated failures at $405–$410 and bounces at $375–$380. Target: $375–$405 range. Invalidation: close outside $372–$412. (30% probability)
- Scenario 3: Bearish Failed Recovery — Price rejects the SMA200/upper-range resistance, MACD rolls over, and −DI retakes control, retesting the Nov 5 low area. Trigger: close below $374, with EMA55 and VWAP lost. Target: $352 (lower band), then $344. Invalidation: close back above $398 on rising volume. (25% probability)
PRICE TARGETS
Timeframe: 34 days (Dec 19, 2026). Range width check: $420.00 − $362.00 = $58.00, which is 14.9% of the $390.22 current price. That falls in the 12–18% guidance for 30–60 days.
- Target Price: $402.00 (about +3% from current)
- Expected Range: $362.00 to $420.00
- Key Levels: Support at $375.00, Resistance at $408.00
OVERALL BIAS
OVERALL BIAS: BULLISH - Price is above all key moving averages with EMA21 above EMA55, CMF shows accumulation, +DI leads, and the Nov 5 breakdown was fully recovered. The conviction is modest because ADX is weak (13.8) and MACD sits just below its signal. The main hurdle is the $405–$410 range resistance.
This is educational analysis and not financial advice.