TSLA 48-day bullish forecast — Nov 15, 2026
- Bias: Bullish
- Timeframe: 48 days (made Nov 15, 2026, target date Jan 1, 2027)
- Price at analysis: $390.22
- Price target: $404.00
- Expected range: $365.00 – $425.00
- Result: Pending — graded after the close on Jan 1, 2027
Get a free AI analysis of TSLA today
Analysis
TECHNICAL INDICATORS
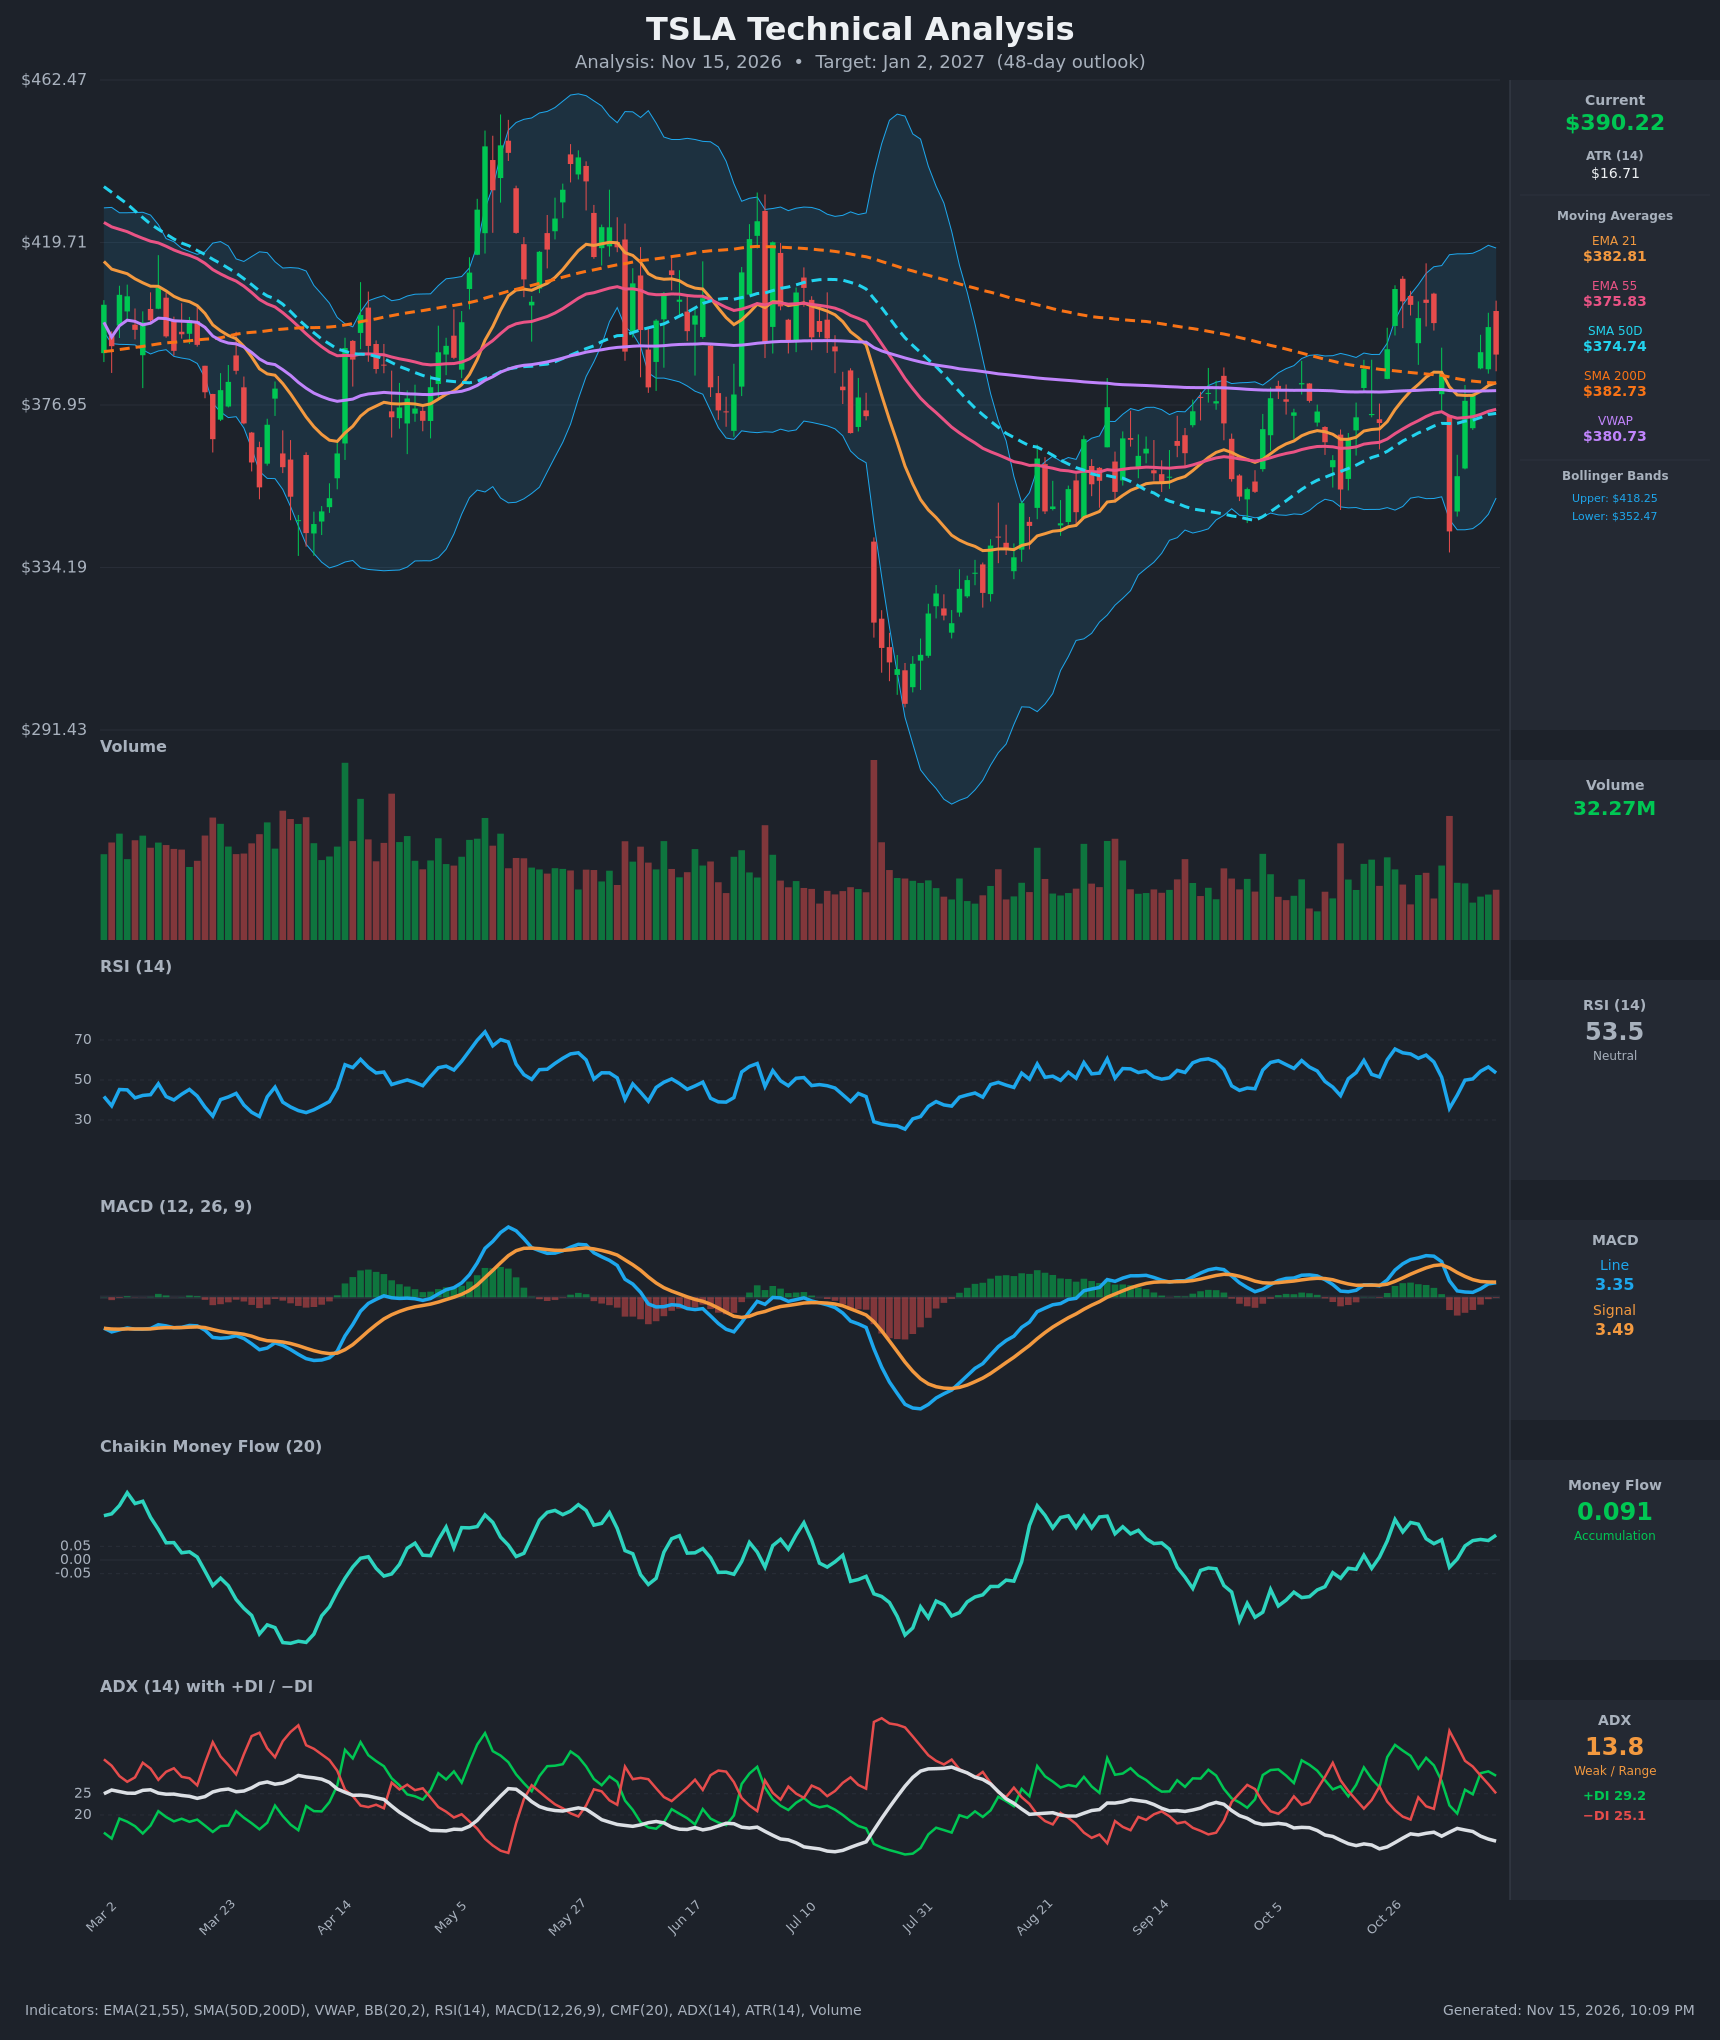
- RSI (14): 53.5, near the midline. It fell to ~35.8 on the Nov 5 flush and has recovered steadily. It is neither overbought nor oversold and leaves room to run in either direction. [Neutral]
- 20 EMA (EMA 21 = $382.81): Price at $390.22 is about 1.9% above it, and the EMA has turned back up after flattening near $379.5. EMA21 is above EMA55 ($375.83), so the short-term trend structure is intact. [Bullish]
- MACD: Line 3.349 vs signal 3.486, a marginal bearish crossover with a slightly negative histogram. The line has been rising since Nov 10 (1.125 → 3.349), though, and the gap is only ~0.14, so it could re-cross upward quickly. Momentum is fading from the October peak (9.6) but stabilizing. [Neutral]
- Bollinger Bands (20): Upper $418.25, lower $352.47, midline ~$385.4. Price is slightly above the midline. The bands are moderately wide after the Nov 5 volatility spike, with no squeeze or band-walk. [Neutral]
- CMF (20): +0.091, above the +0.05 threshold. It has been positive on almost every bar except Nov 5 and has recovered quickly, so dips are being bought. [Accumulation]
- ADX (14): 13.8 and drifting lower, so there is no meaningful trend. +DI (29.2) is above −DI (25.1), a modest bullish edge, but the gap is narrow. [Weak Trend, slight bullish tilt]
- Volume: 32.27M, below the spikes seen on the Nov 5 breakdown candle and well off the big Aug highs. The recent recovery has come on modest volume, so it lacks strong conviction. [Neutral to mildly supportive]
Moving-average context:
- Price is above EMA21, EMA55, SMA50D ($374.74), SMA200D ($382.73) and VWAP ($380.73), a tight cluster of support just below.
- SMA50D is still below SMA200D, so no golden cross has occurred. The gap has narrowed from about $21 to about $8, and a golden cross is plausible within the window if price holds.
DIVERGENCES & TRENDS
- There is no clear price/RSI divergence. The Nov 5 low (RSI ~36) was a higher-RSI low than the Aug lows (RSI < 30) while price made a similar low, a mild positive sign for momentum.
- Price made a lower high versus Oct 27 ($407.46) on the Nov 12 bounce ($397.45). The MACD peak also fell (9.59 → 3.35), a mild bearish momentum fade within the range.
- The MACD signal-line cross is marginally bearish, but the MACD line is rising and may re-cross.
- DI lines: −DI crossed above +DI on Nov 4–6, then +DI retook the lead on Nov 9. This is a bullish recovery, but the ADX of ~14 means the signal is weak.
- CMF has stayed above +0.05 for most of the past month, which supports accumulation.
- SMA200D is now flat to slightly declining and acting as the pivot. Price has just reclaimed it.
CHART PATTERNS
- Rectangle / range consolidation: Since August, price has been oscillating roughly between $345 and $420, with weak ADX supporting a sideways regime. Mid-range sits near $385, essentially where price is now.
- Possible Bullish Double Bottom (reference diagram): The Sep lows (~$348) and the Nov 5 flush low (~$343) form a rough double bottom. The neckline is around $407-$412, the Oct 27 highs. A confirmed close above ~$412 would give a measured move toward $470, but that is an extended target beyond the 48-day horizon. The pattern is unconfirmed until the neckline breaks.
- Bearish alternative: Lower highs on the recent bounce and a flattening MACD could develop into a Bearish Double Top near $407-$410 if the neckline at ~$375-$383 breaks. A close below ~$375 would target the $345-$352 zone.
POTENTIAL SCENARIOS
- Scenario 1: Bullish Range Breakout Attempt — Price holds the $376-$383 MA cluster, MACD re-crosses upward, and CMF stays positive, driving a push toward the top of the range and possibly a golden cross of SMA50D/SMA200D. Trigger: daily close above $398-$400 with MACD re-cross. Target: $404-$418 (upper Bollinger Band). Invalidation: daily close below $375. (45% probability)
- Scenario 2: Neutral Range Chop — ADX stays below 20 and price oscillates around the $383-$385 midline between $360 and $410. Trigger: repeated failures at $407-$410 and bounces at the $375-$380 cluster. Target: $380-$395. Invalidation: close above $412 or below $370. (30% probability)
- Scenario 3: Bearish Rejection and Breakdown — Price fails at the SMA200 and the lower high structure persists, with MACD turning down further and −DI retaking the lead. Trigger: close below $375.83 (EMA55/SMA50D confluence). Target: $352 (lower Bollinger Band), then $343. Invalidation: close above $400. (25% probability)
PRICE TARGETS
For the 48-day horizon, ATR of $16.71 implies a typical swing of roughly ±$58 at the 1-sigma extreme, so the range is scaled to ~15% of price.
- Target Price: $404.00
- Expected Range: $365.00 to $425.00 (width $60 ≈ 15.4% of current price, consistent with the 30-60 day guidance)
- Key Levels: Support at $375.83 (EMA55/SMA50D confluence), Resistance at $408.00 (Oct 27 swing high area; the upper Bollinger Band at $418.25 is the next barrier)
OVERALL BIAS
OVERALL BIAS: BULLISH - Price is above every major moving average and VWAP, CMF shows accumulation, +DI leads −DI, and the Nov 5 flush was bought back quickly. The weak ADX and marginal MACD cross cap conviction, so the expected gain is modest, toward the upper part of the range.
This is educational analysis and not financial advice.