TSLA 27-day bullish forecast — Nov 15, 2026
- Bias: Bullish
- Timeframe: 27 days (made Nov 15, 2026, target date Dec 11, 2026)
- Price at analysis: $390.22
- Price target: $400.00
- Expected range: $365.00 – $425.00
- Result: Pending — graded after the close on Dec 11, 2026
Get a free AI analysis of TSLA today
Analysis
TECHNICAL INDICATORS
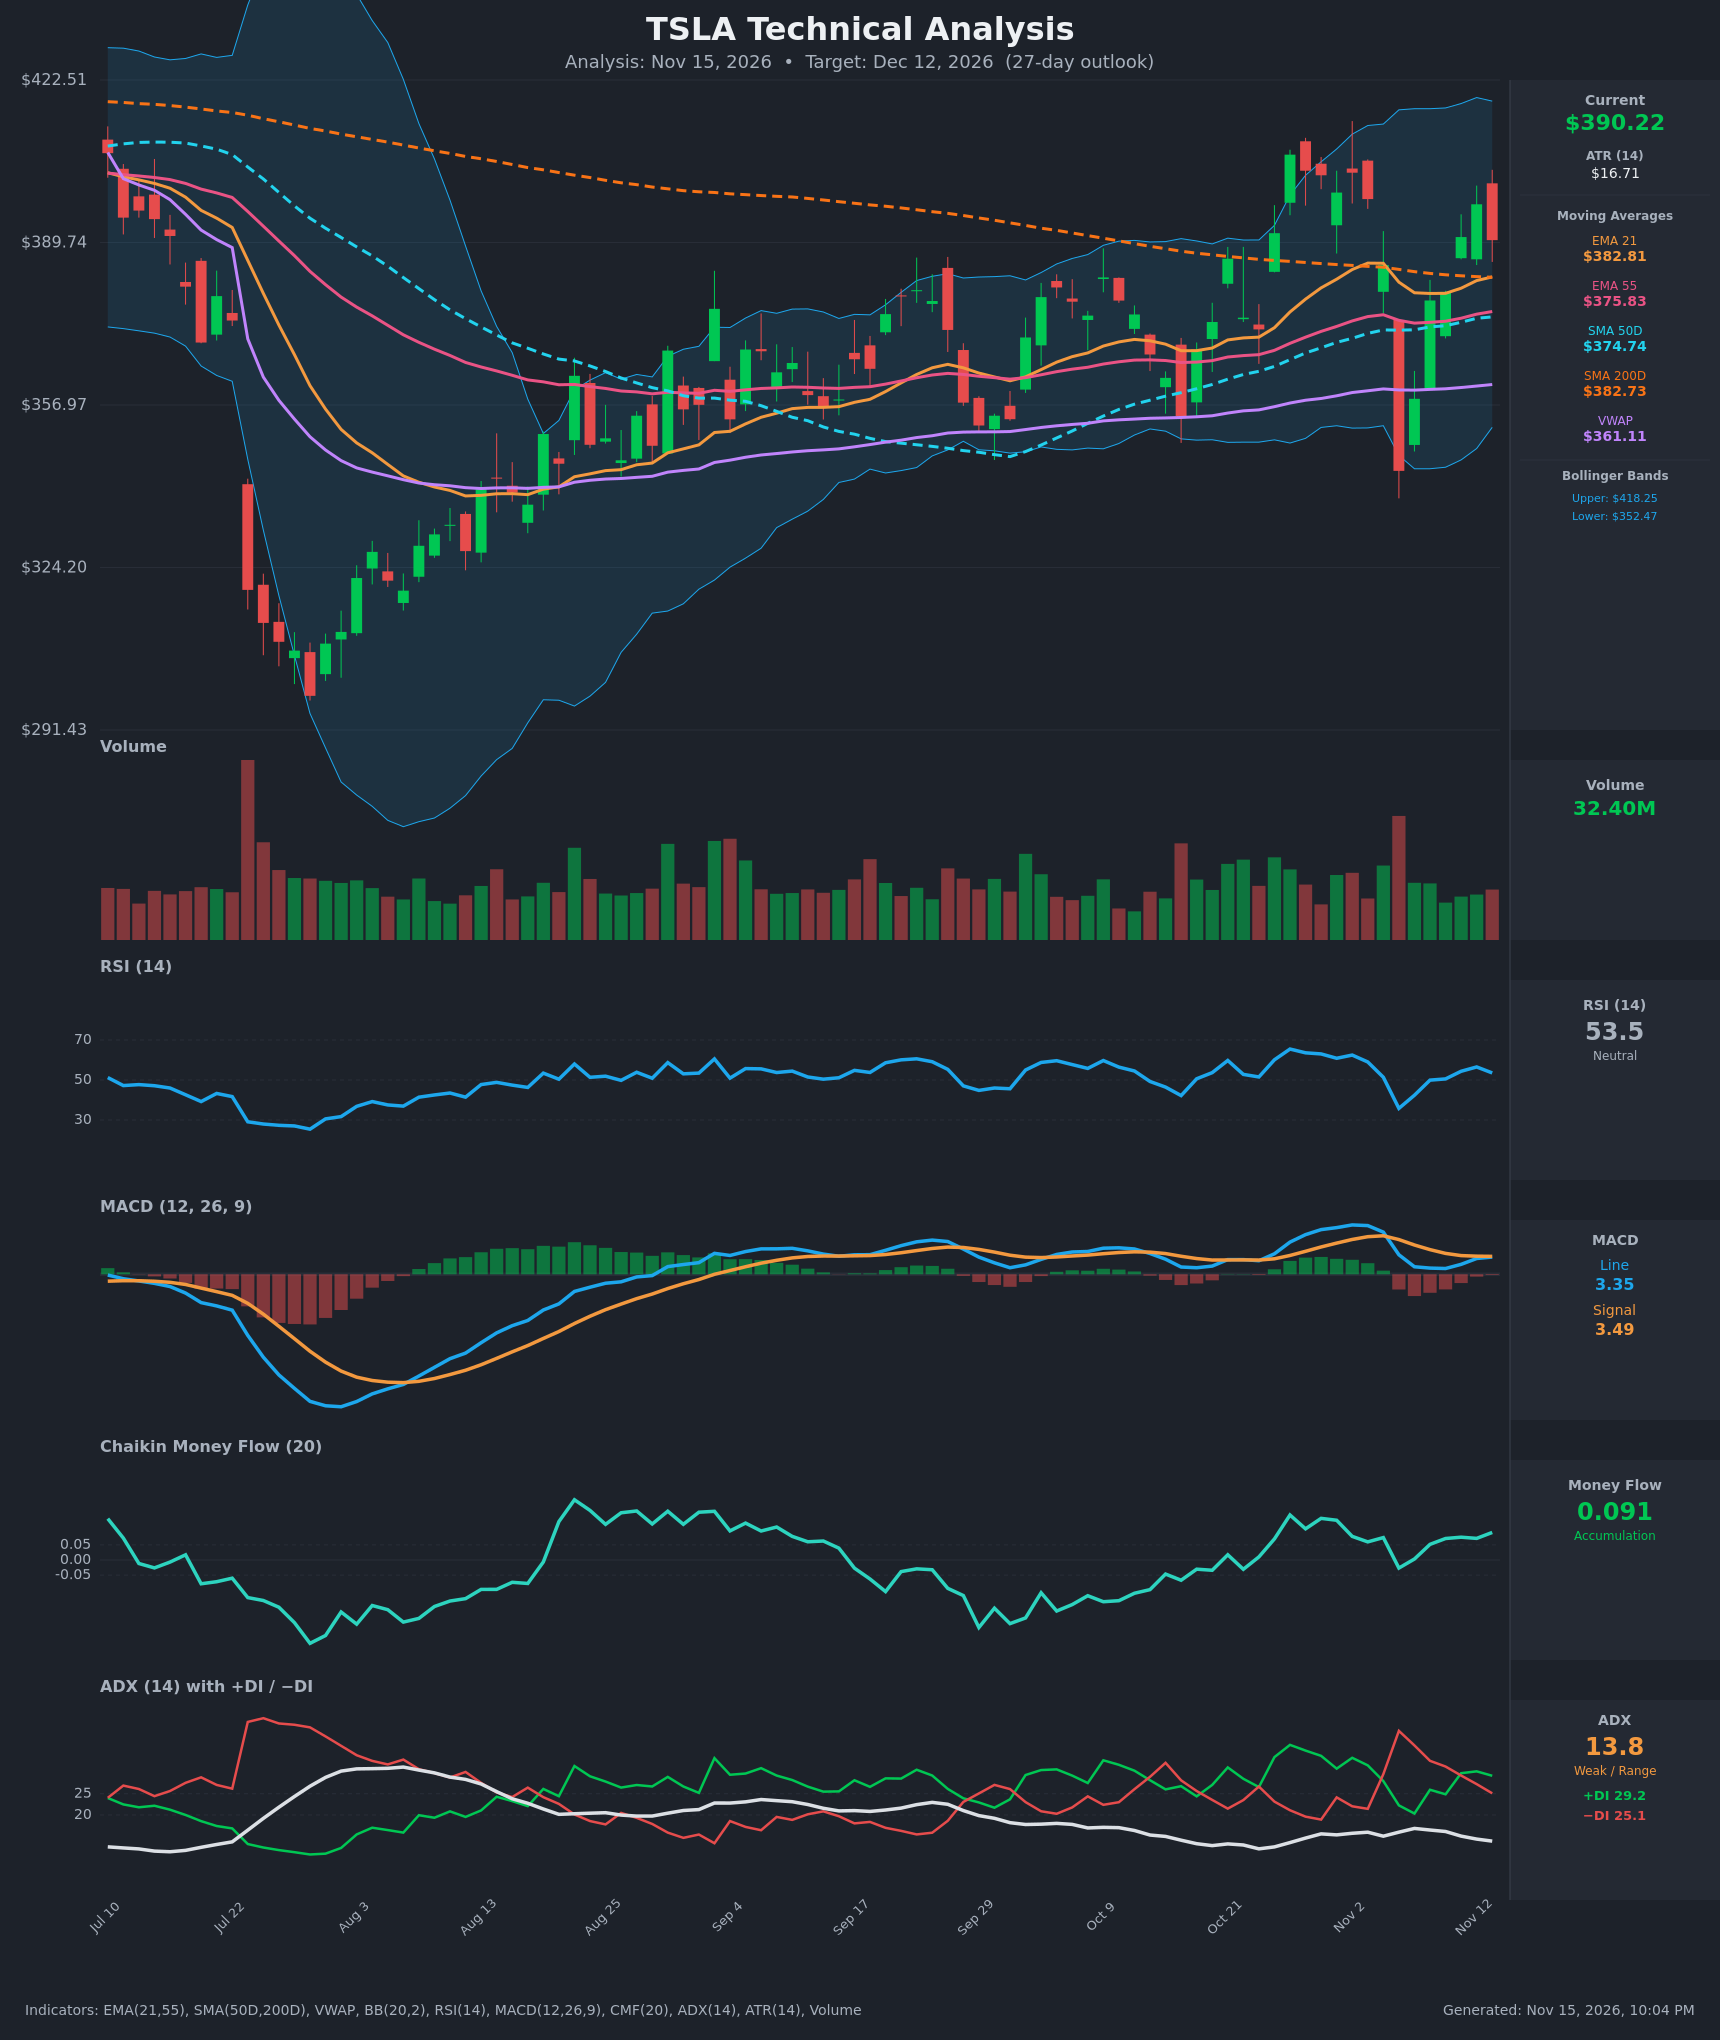
- RSI (14): 53.54, mid-range and neutral. It fell to 35.8 on the Nov 5 flush, recovered to a 56.5 peak on Nov 12, and has ticked down slightly since. There is no overbought or oversold reading, and momentum is recovering but flattening. [Neutral]
- 20 EMA (EMA 21 used): $382.81, with price at $390.22 about 1.9% above it. The EMA21 is above the EMA55 ($375.83) and turning up again after the Nov 5 dip, so it should act as first support. [Bullish]
- MACD: Line 3.349 vs. Signal 3.486, so the line is marginally below the signal and the histogram is about -0.14. The histogram has narrowed from the Nov 5-6 lows, and the line is rising (1.13 → 3.35) and sitting on the signal line. A bullish re-cross looks imminent, but it has not happened yet. [Neutral]
- Bollinger Bands (20): Upper $418.25, lower $352.47, midline about $385. Price sits just above the midline, with the bands wide after the Nov 5 volatility spike. There is room to the upper band (+7%) and more to the lower band (-9.7%). [Neutral]
- CMF (20): 0.091, above +0.05 and consistently positive (0.05-0.09) since the Nov 9 recovery. This shows modest accumulation despite the heavy-volume Nov 5 drop. [Accumulation]
- ADX (14): 13.8 with +DI 29.2 over −DI 25.1. ADX is below 20 and drifting lower, so there is no meaningful trend and the market is range-bound. The slight bullish DI edge has narrowed from the Oct 27 spread (36.5 vs. 21.1). [Weak Trend, slight bullish lean]
- Volume: 32.40M, below the heavy-volume spikes seen on the Nov 5 selloff and late-July capitulation. The Nov 9-13 rebound came on moderate volume, with green volume bars slightly dominant. Participation is fading, which fits consolidation rather than a breakout. [Neutral to mildly bullish]
DIVERGENCES & TRENDS
- Moving-average structure: Price ($390.22) is above the EMA21, EMA55, SMA50D ($374.74), SMA200D ($382.73) and VWAP ($361.11), a constructive stack. The MAs are bunched between $375 and $383, which signals compression and a coming expansion.
- SMA50/SMA200: The SMA50D is still below the SMA200D by about $8. The gap has narrowed from about $21 on Oct 26 as the SMA50 rises and the SMA200 falls. A golden cross is possible within the 27-day window if price holds up, but it is not confirmed.
- MACD: The Oct 30-Nov 3 peak (MACD above 9) rolled over, followed by a bearish cross on Nov 5. The line has since recovered and is almost back at the signal, so a bullish re-cross is the next likely event.
- RSI/CMF: The RSI recovery from 35.8 to the mid-50s and the positive CMF both support a higher-low structure. Price has not made a lower low since the Nov 5 flush ($343.69).
- ADX: There is no trend. The Nov 5 −DI spike (39.8) has faded, and +DI has retaken the lead. This is a mild bullish shift in control, not a trend.
- No major divergences: Price, RSI and CMF are broadly aligned.
CHART PATTERNS
- Range / consolidation: Price has traded in a broad $340-$411 band since September. The recent swing highs near $407-$411 (Oct 27-28) and the $397 retest on Nov 12 form resistance, while the Nov 5 flush low near $344 and the $355-$358 area form support.
- Potential Bearish Double Top (reference diagram): The $407-$411 highs, if rejected again, could form a double-top or triple-top style structure with a neckline near $375-$380 (EMA55/SMA50 zone). A close below $375 would activate this, with a measured target near $345.
- Potential bullish setup: The Nov 5 capitulation low followed by a V-shaped recovery and higher closes is a double-bottom-like or ascending-triangle-like build, with a flat top near $410 and rising lows. A break above $411 would target about $425-$435 (the measured move from the $345 low).
- Compression: The clustered MAs and weak ADX suggest a coiled structure similar to a symmetrical triangle. A break is likely, and the bullish MA stack gives the upside break a slight edge.
POTENTIAL SCENARIOS
- Scenario 1: Bullish Breakout Toward the Upper Range — Price holds above the EMA21/SMA200 cluster, MACD re-crosses bullish, and CMF stays positive, allowing a push through the Oct highs. A golden cross of the SMA50 and SMA200 would add momentum. Trigger: daily close above $398 and then $411 with MACD bullish cross. Target: $410-$425. Invalidation: daily close below $375. (45% probability)
- Scenario 2: Neutral Range-Bound Chop — With ADX below 15, price oscillates between the moving-average cluster and the Oct highs. Trigger: failure to close above $411 and holding $375. Target: $380-$400. Invalidation: close above $411 or below $370. (30% probability)
- Scenario 3: Bearish Rejection and Breakdown — Price rejects at $397-$411 (double-top-like) and loses the $375 confluence of EMA55/SMA50, with −DI retaking the lead as on Nov 5. Trigger: close below $375 on rising volume. Target: $352 (lower Bollinger Band), then $344. Invalidation: reclaim of $390 and the EMA21. (25% probability)
PRICE TARGETS
- Target Price: $400.00 (27-day horizon, about +2.5% from $390.22)
- Expected Range: $365.00 to $425.00 (width $60 = 15.4% of current price, in line with the 12-18% guidance for 30-60 days scaled down for 27 days, and about 3x wider than a 2-3 day range)
- Key Levels: Support at $375.00 (EMA55/SMA50 confluence), Resistance at $411.00 (Oct swing highs)
OVERALL BIAS
OVERALL BIAS: BULLISH - Price is above all key moving averages and VWAP, CMF shows accumulation, +DI leads −DI, and MACD is on the verge of a bullish re-cross after the Nov 5 flush was fully retraced. Conviction is modest because ADX is only 13.8 and resistance at $398-$411 is close.
This is educational analysis and not financial advice.