TSLA 83-day bullish forecast — Nov 15, 2026
- Bias: Bullish
- Timeframe: 83 days (made Nov 15, 2026, target date Feb 5, 2027)
- Price at analysis: $390.22
- Price target: $420.00
- Expected range: $355.00 – $445.00
- Result: Pending — graded after the close on Feb 5, 2027
Get a free AI analysis of TSLA today
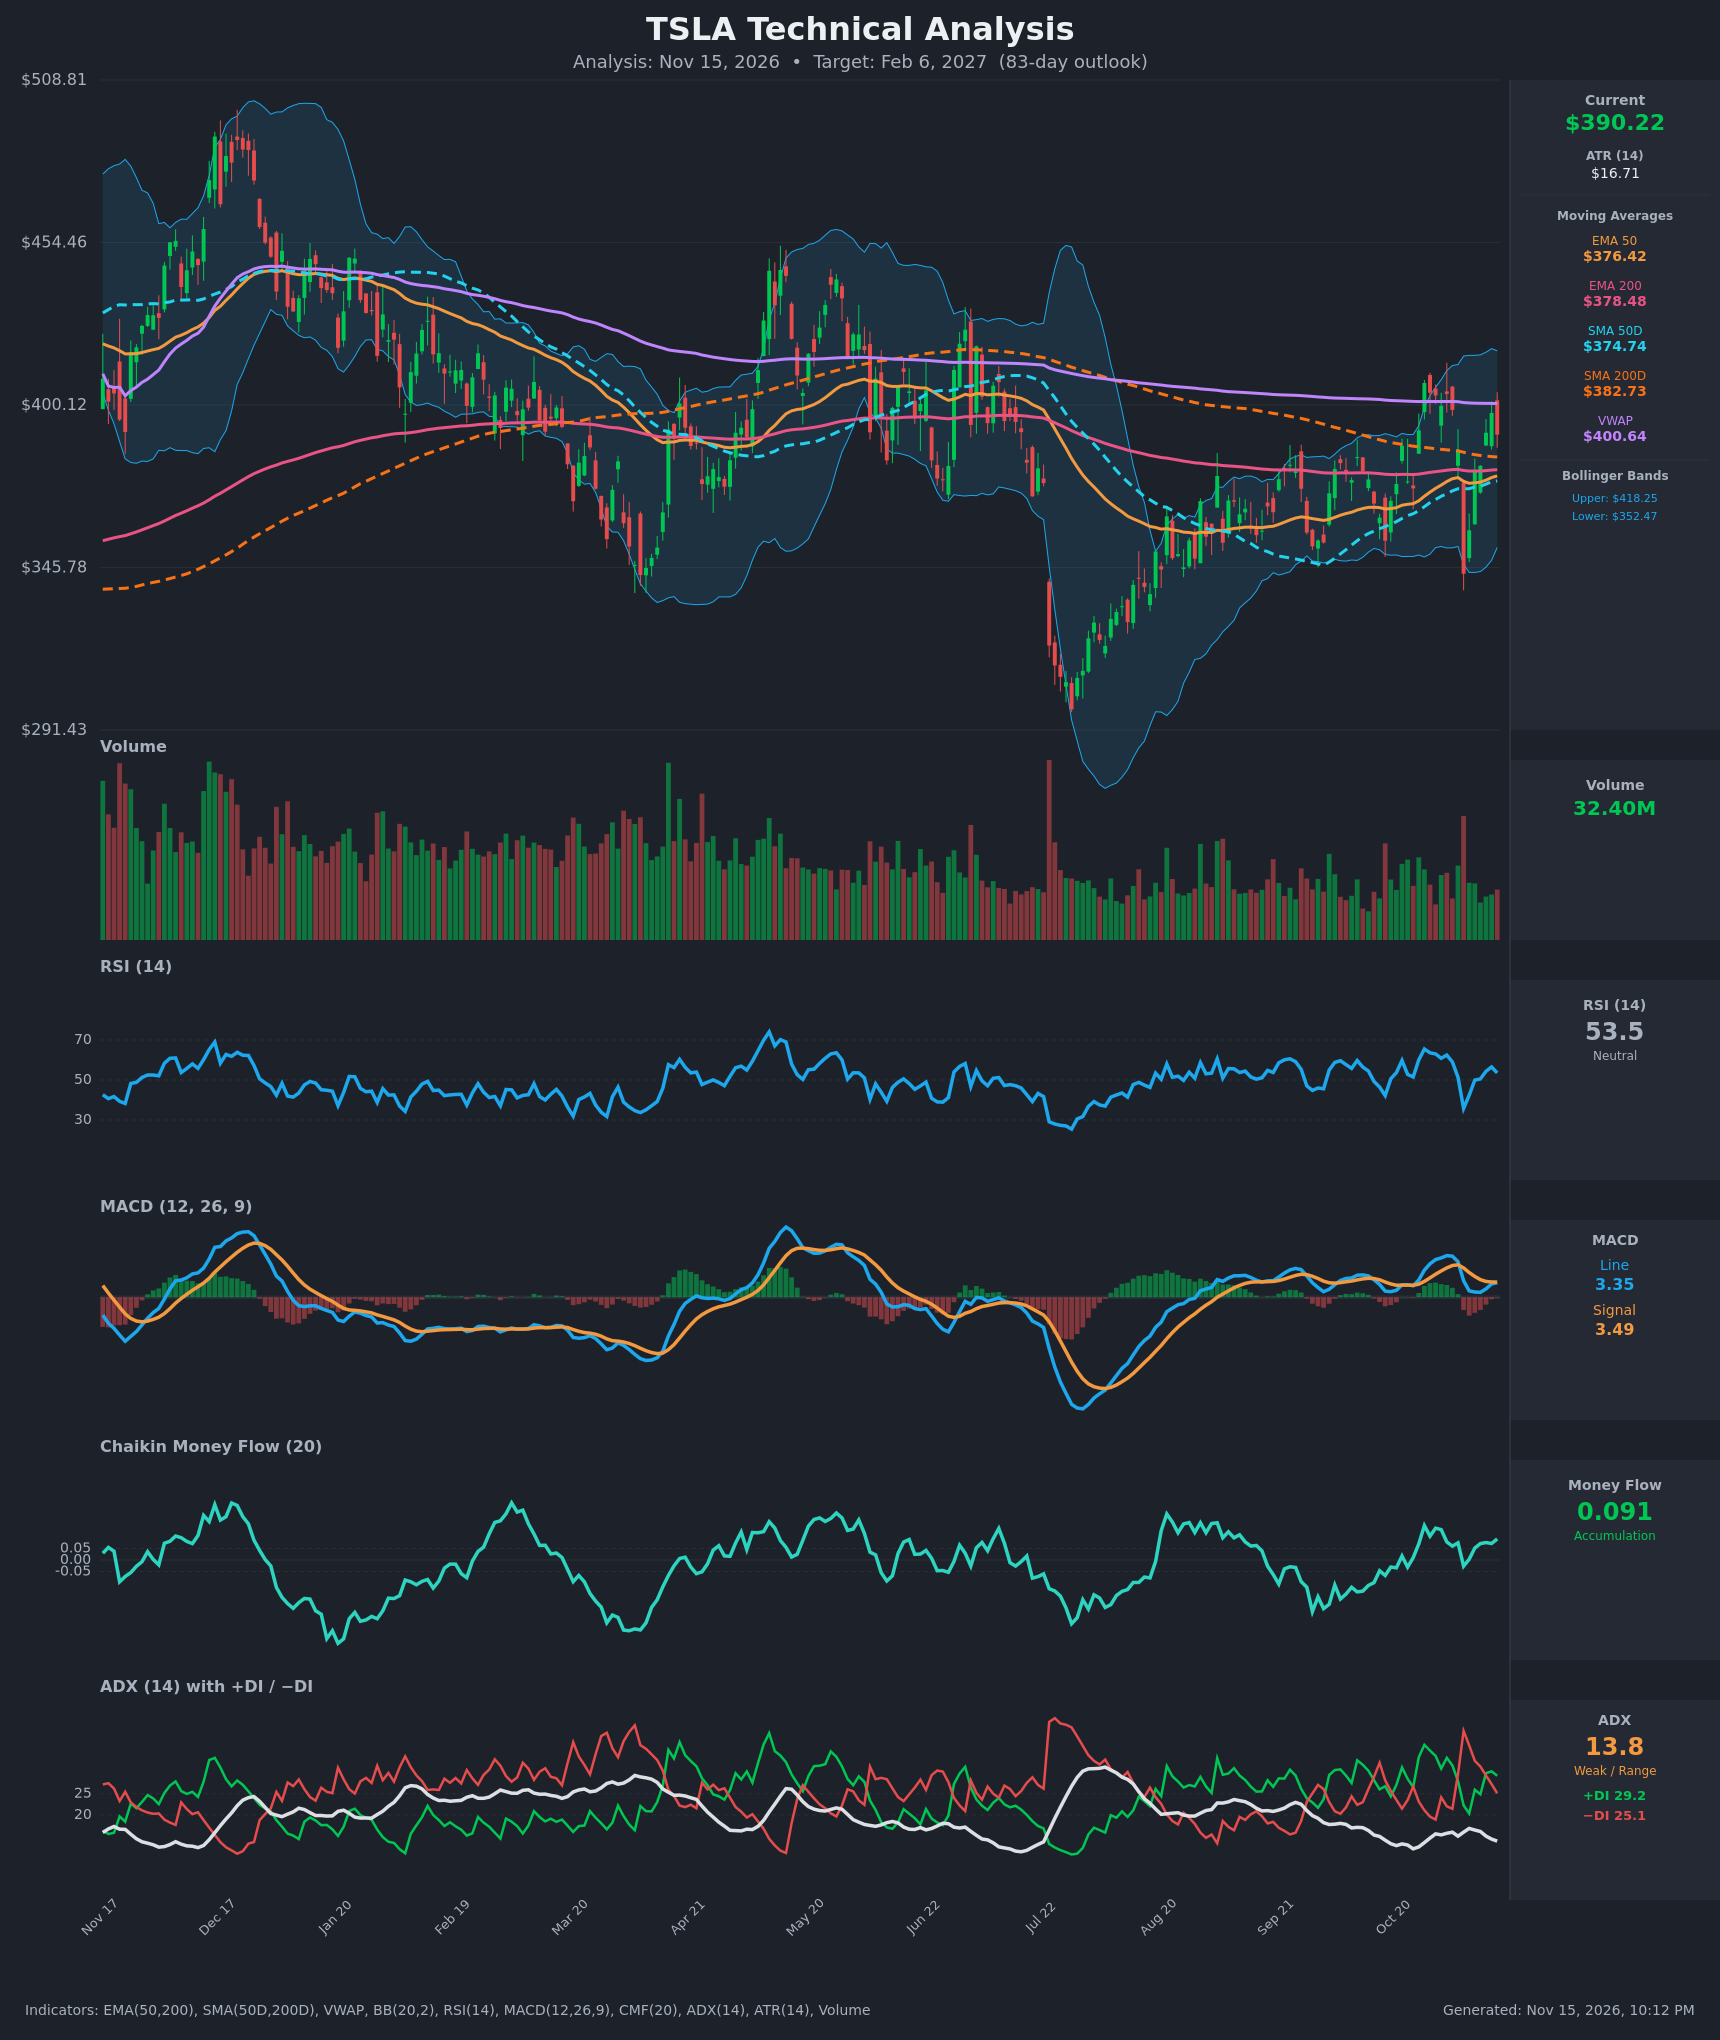
Analysis
TECHNICAL INDICATORS
- RSI (14): 53.54, mid-range and neutral. It has recovered from 35.8 on Nov 5 and is now ranging between 50 and 56, with no overbought or oversold pressure. [Neutral]
- 20 EMA: Not supplied. The Bollinger midline (the 20-period average) is about $385.4, and price at $390.22 sits just above it, which is mild support. Price is also above the EMA50 ($376.42) and EMA200 ($378.48). [Bullish]
- MACD: Line 3.349 vs signal 3.486, so the line sits just under the signal. The histogram is about -0.14, up from -0.45 the day before, so bearish momentum is fading. A bullish recross looks likely within a few sessions, but the readings are close to zero and show no strong momentum. [Neutral]
- Bollinger Bands (20): Upper $418.25, lower $352.47, with price at $390.22 in the upper half of the band (about 57% of the range). The bands are moderately wide after the Nov 5 flush to $343.69, which closed back inside the bands. [Neutral]
- CMF (20): 0.091, above the +0.05 threshold and positive in most recent bars. That points to steady accumulation even through the Nov 5 selloff. [Accumulation]
- ADX (14): 13.8 with +DI 29.2 above −DI 25.1. This is a weak, range-bound reading, though the DI spread favors the bulls. The ADX is drifting lower, so there is no established trend yet. [Weak Trend, slight bullish lean]
- Volume: 32.40M, below the spikes seen at the Nov 5 selloff and the Jul breakdown. The latest bar is on subdued participation, and the recovery bars from Nov 9 onward show decent buying volume. [Neutral to mildly bullish]
DIVERGENCES & TRENDS
- Moving averages: Price is above the EMA50, EMA200, SMA50D and SMA200D ($382.73), which is a long-term-positive structure. It remains below VWAP ($400.64), so the VWAP is overhead resistance.
- Crossovers: EMA50 ($376.42) is still $2.06 below EMA200 ($378.48), and the gap is narrowing. A golden-cross-style EMA50/EMA200 crossover is close. SMA50D ($374.74) sits $8 below SMA200D ($382.73), and that gap is closing as the SMA200D rolls over. A golden cross is possible in the coming weeks.
- MACD: The line recently dipped below the signal line, and the histogram is turning back up. It is a marginal, unconfirmed signal.
- RSI: After the Nov 5 low (35.8), RSI made a higher low and recovered above 50. Price made a lower low in early Nov (343.69) than in Sep but held it, so there is no bearish divergence.
- ADX/DI: +DI crossed back above −DI on Nov 9, which is a mild bullish shift. ADX at 13.8 means no trend strength is confirmed.
- Longer trend: The chart shows a bottom at about $300 in July, followed by higher lows into Sep and Nov. The 200-day averages are flattening and converging on price.
CHART PATTERNS
- Bullish Double Bottom: Lows near $345 in Sep and $343.69 on Nov 5 (rapidly recovered) form a double-bottom base. The neckline sits near the Oct high of about $425-430. A close above it would project toward the $480-510 area, since the pattern's height is about $85. This is a longer-term target and is only partly achievable within 83 days.
- Broad range / rounded base: Price has built a base above the July low and is coiling between about $343 and $430 with converging moving averages. A move above the VWAP and Bollinger upper band would confirm a breakout.
- Caution: A close back below $375 (the EMA/SMA50 cluster) would weaken the base thesis and invalidate the double bottom.
POTENTIAL SCENARIOS
- Scenario 1: Bullish Base Breakout — Price holds the $375-378 moving-average cluster, MACD recrosses up, and a golden cross forms. Price reclaims VWAP and pushes toward the Oct highs. Trigger: daily close above $401 (VWAP), then above $418 (upper BB). Target: $420-$430, extending toward $455 on a neckline break. Invalidation: daily close below $370. (50% probability)
- Scenario 2: Neutral Range Consolidation — ADX stays below 20, and price oscillates between $360 and $410 around the converged moving averages. Trigger: repeated rejections at VWAP and defense of the EMA cluster. Target: $385-$400. Invalidation: close above $418 or below $352. (25% probability)
- Scenario 3: Bearish Breakdown — Price loses the $375 cluster, retests the Nov 5 low, and fails the double bottom. Trigger: close below $374.74, then below $352.47. Target: $343, then $320. Invalidation: reclaim of $400. (25% probability)
PRICE TARGETS
Timeframe: 83 days (Feb 6, 2027).
Self-check: Expected Range width is $90 ($355 to $445), which is 23.1% of the current price of $390.22. This fits the 18-30% guidance for 61-180 days.
- Target Price: $420.00 (83-day target)
- Expected Range: $355.00 to $445.00
- Key Levels: Support at $374.74, Resistance at $400.64
OVERALL BIAS
OVERALL BIAS: BULLISH - Price is above all four major moving averages, with CMF showing accumulation and +DI above −DI. A double-bottom base is forming off the $343-345 lows, and the EMA/SMA crossovers are converging toward a bullish setup. Conviction is moderate because ADX is weak and MACD is flat, and VWAP at $400.64 remains overhead resistance.
This is educational analysis and not financial advice.