TSLA 6-day bearish forecast — Nov 1, 2026
- Bias: Bearish
- Timeframe: 6 days (made Nov 1, 2026, target date Nov 6, 2026)
- Price at analysis: $399.82
- Price target: $395.50
- Expected range: $385.50 – $407.00
- Result: Correct (-10.4%) — closed at $358.22 on Nov 6, 2026; quality score 50/100
Get a free AI analysis of TSLA today
Analysis
TECHNICAL INDICATORS
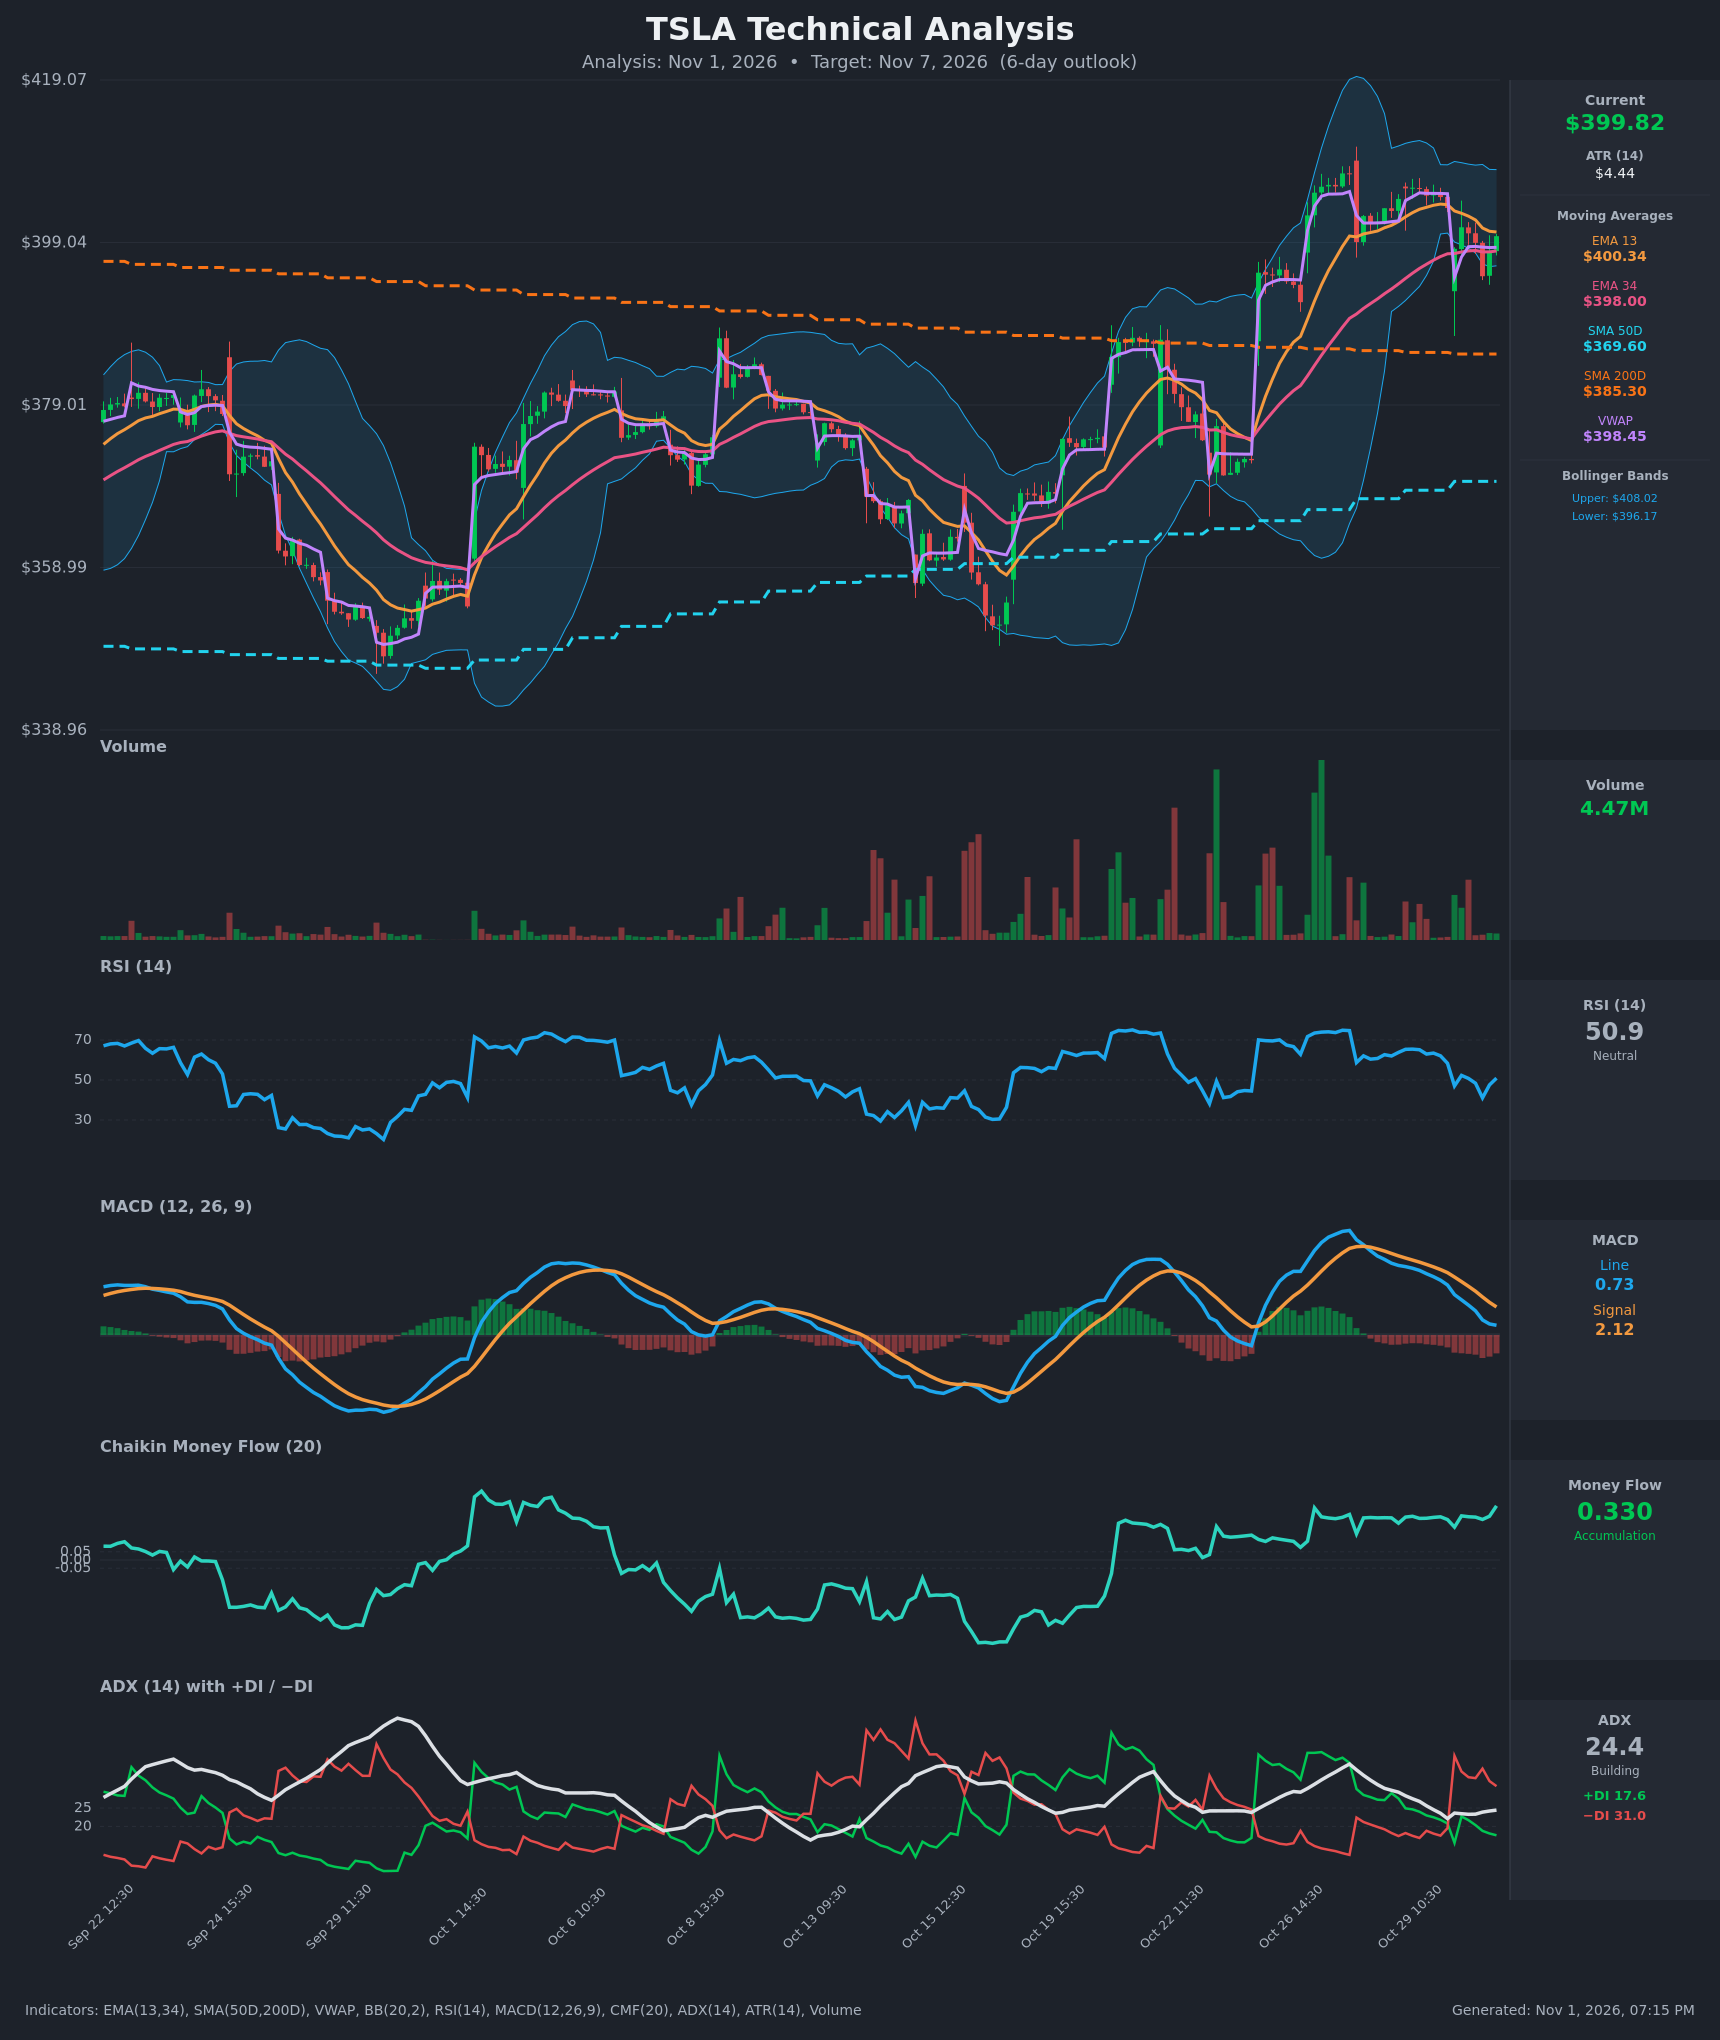
- RSI (14): 50.92, dead neutral. It dropped from 65 to a low of 41 on Oct 30 and has bounced back to about 51. Momentum has reset from the overbought-leaning zone but has no directional edge. [Neutral]
- 20 EMA (EMA 13 / EMA 34 provided): Price ($399.82) sits just below EMA13 ($400.34) and just above EMA34 ($397.996). EMA13 is still above EMA34, but the gap has narrowed from about $8 to about $2.3, and EMA13 is rolling over. EMA13 is overhead resistance and EMA34 is the first support. [Neutral]
- MACD: Line 0.734 is below Signal 2.119, a bearish crossover that happened around Oct 28-29. The histogram is -1.385, still negative. It is narrowing slightly from about -1.77, but the line keeps falling and is near the zero line. [Bearish]
- Bollinger Bands (20): Upper $408.02, lower $396.17, midline about $402.1. Price is in the lower half, about $3.6 above the lower band. The bands are fairly tight after the expansion, so a volatility move is possible. A midline rejection favors a test of the lower band. [Bearish]
- CMF (20): 0.330, well above +0.05, and it has held above 0.20 throughout the pullback. This is persistent accumulation, and money flow has not confirmed the price dip. [Accumulation]
- ADX (14): 24.4, just below the 25 trend threshold and building, with −DI 31.0 above +DI 17.6. Bears currently control directional movement. The −DI spike on Oct 30 (39.2) was a sharp sell-off, and the −DI/+DI gap is wide. [Moderate Trend, Bearish direction]
- Volume: 4.47M, light and lower than the volume spikes on the earlier rally. The pullback is on modest volume, so there is no heavy distribution, but the bounce attempts lack conviction too. [Neutral / Low-conviction]
Other context:
- VWAP is $398.45 and price is slightly above it, which is mildly supportive.
- SMA50D ($369.60) and SMA200D ($385.30) are both well below price. Price is above SMA200D, so the long-term uptrend is intact, and SMA50D is rising toward SMA200D.
DIVERGENCES & TRENDS
- MACD vs. price: Price is still near its highs (about 400 vs. a 405.8 peak), but MACD has fallen from about 5.9 to 0.7. This is a bearish momentum fade, not a classic divergence.
- CMF vs. price/MACD: CMF is at 0.33 while price and MACD both weaken. This is a bullish divergence in money flow and the main counterweight to the bearish signals.
- RSI: It made a higher low (41) than the prior lows near 30, and has recovered to 51. It is not yet trending either way.
- Crossovers:
- The MACD bearish cross is confirmed.
- The −DI over +DI cross happened on Oct 30 and has persisted.
- EMA13 is converging toward EMA34, with a possible bearish cross within a few sessions if price slips.
- SMA50D is still below SMA200D, so a golden cross is not yet in place.
- Trend: The Oct 22–28 rally ran from about 365 to 405. Since then price has made lower highs and lower lows on the hourly bars (405.8, 400.9, 398), which is a short-term downward drift.
CHART PATTERNS
- No clean reference pattern is confirmed. The post-rally action (405.8 high, then lower highs, with price compressing toward EMA34/VWAP) resembles a Bullish Flag / Pennant (continuation) in a loose sense. The flagpole is the move from about 365 to 405.
- A flag breakdown below roughly 394–396 would turn it into a failed flag, similar to a Bearish Expanding/Symmetrical Triangle break. That would target the 385 area (SMA200D), a measured move of about $10–15.
- The flag-based bullish target on a break above about 406 would be about 415–419, near the top of the chart range.
- With ADX near 24 and −DI dominant, the pattern leans toward a pullback resolving lower before any continuation.
POTENTIAL SCENARIOS
- Scenario 1: Bearish Pullback to Lower Band/Support — MACD stays below Signal, −DI keeps control, and price loses EMA34/VWAP, then slides toward the lower Bollinger Band and below. Trigger: hourly close below $396.17 (lower BB) after failing at the EMA13/midline near $400–402. Target: $392–$388, with an extension to the SMA200D at $385.30. Invalidation: a close above $405.80 (recent high). (45% probability)
- Scenario 2: Bullish Flag Continuation — CMF accumulation and the intact uptrend above the SMA50D/200D lift price back through EMA13 and the Bollinger midline, so the dip is bought. Trigger: close above $402–$403 and then $406 with rising volume, plus a MACD histogram turn. Target: $408 (upper BB), then $414–$418. Invalidation: a close below $395. (35% probability)
- Scenario 3: Neutral Range Chop — Price oscillates between EMA34/lower band support and EMA13/midline resistance with ADX fading below 22. Trigger: ADX falling and price staying between $396 and $404. Target: $398–$402. Invalidation: a decisive close outside $394–$406. (20% probability)
PRICE TARGETS
The 6-day horizon calls for a range width of about 4-8% of current price. Self-check: the range is $385.50 to $407.00, which is $21.50, or 5.4% of $399.82. That is correct for 6 days, and wider than a 2-3 day range would be.
- Target Price: $395.50 (6-day outlook, a modest pullback of about -1.1% toward the lower Bollinger Band and a bit below it)
- Expected Range: $385.50 to $407.00
- Key Levels: Support at $396.17 (lower Bollinger Band; then $385.30 SMA200D), Resistance at $405.80 (recent swing high; $408.02 upper BB above that)
OVERALL BIAS
OVERALL BIAS: BEARISH - MACD is below its signal line with a negative histogram, −DI (31.0) dominates +DI (17.6), and price is below EMA13 and the Bollinger midline with lower highs since the 405.8 peak. Strong CMF accumulation (0.33) and the intact uptrend above the SMA50D/200D limit the downside, so conviction is modest and a pullback toward $395 or lower is the more likely path.
This is educational analysis and not financial advice.