BAC 4-day bearish forecast — Nov 1, 2026
- Bias: Bearish
- Timeframe: 4 days (made Nov 1, 2026, target date Nov 4, 2026)
- Price at analysis: $50.01
- Price target: $49.65
- Expected range: $48.80 – $50.75
- Result: Incorrect (+3.3%) — closed at $51.64 on Nov 4, 2026; quality score 17/100
Get a free AI analysis of BAC today
Analysis
TECHNICAL INDICATORS
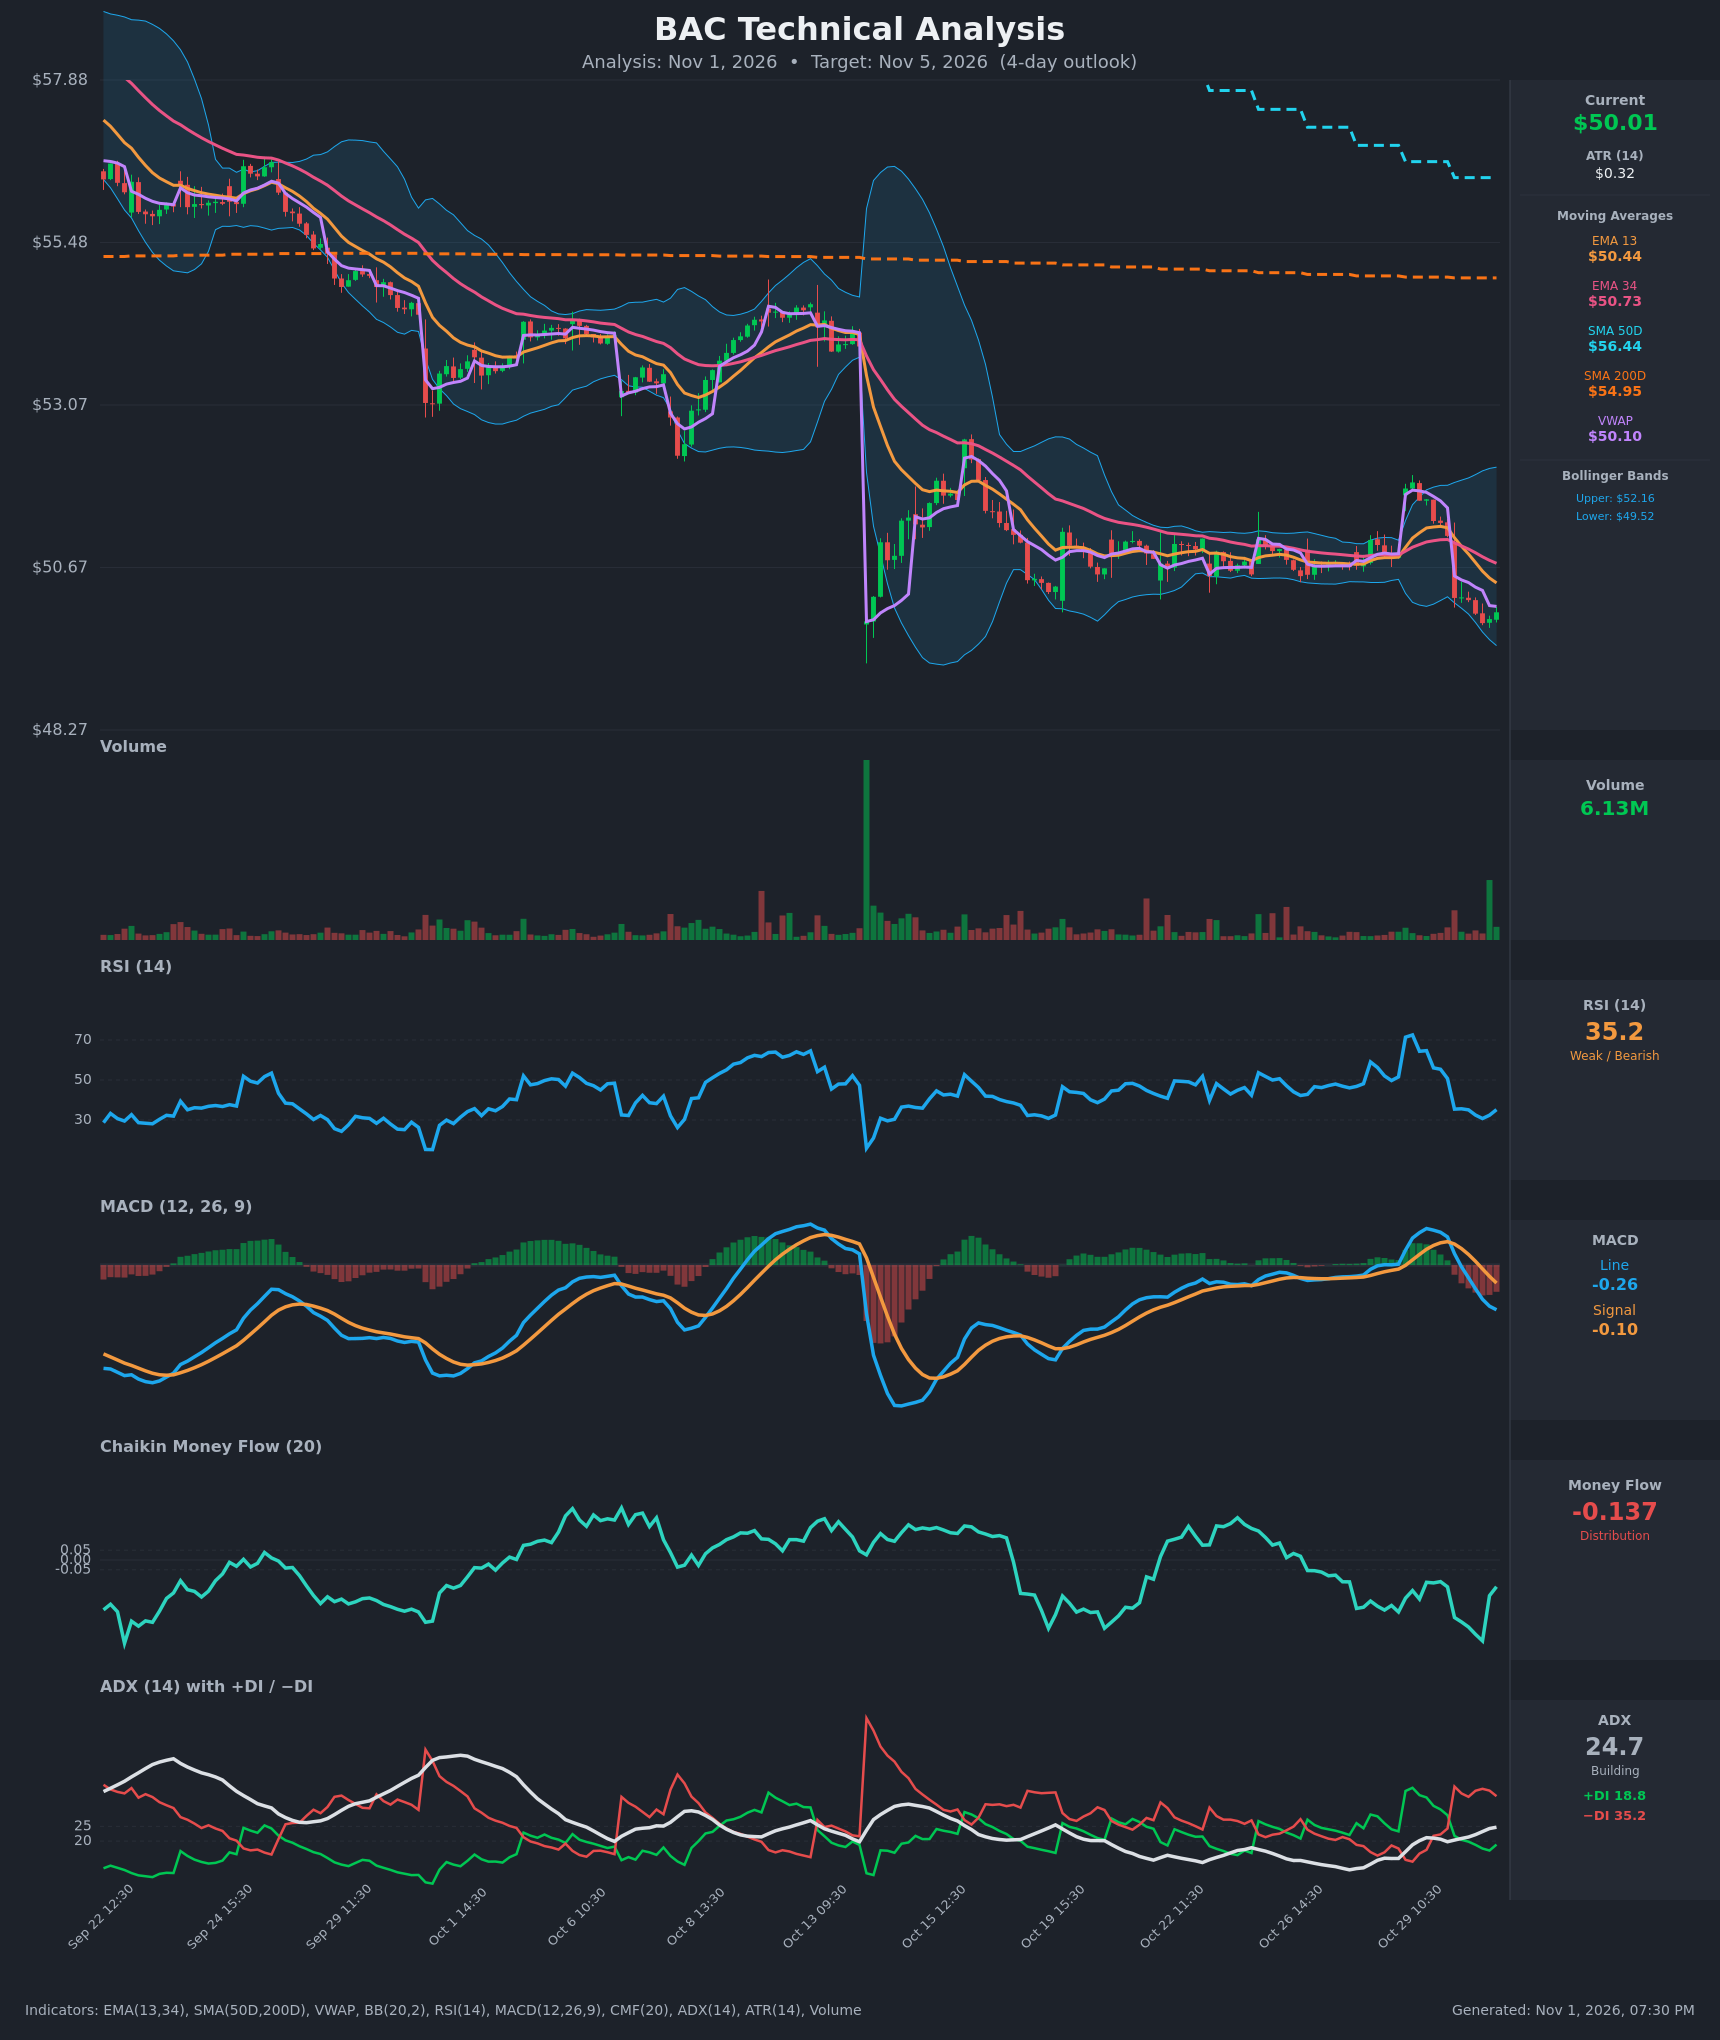
- RSI (14): 35.18, just bouncing off 30.7 on Oct 30 13:30 after dropping from 72.5 on Oct 29. It sits in the weak zone, close to oversold but not there. Momentum is bearish, though the downside is getting stretched. [Bearish]
- 20 EMA: The supplied values are EMA 13 at $50.44 and EMA 34 at $50.73. Price at $50.01 is below both. EMA13 crossed below EMA34 on Oct 30 around 10:30, and both slope down, so they act as overhead resistance. [Bearish]
- MACD: Line -0.256, signal -0.103, histogram about -0.15 and widening. The bearish crossover happened on Oct 30 around 13:30, and both lines are moving further below zero. [Bearish]
- Bollinger Bands (20): Upper $52.16, lower $49.52, midline about $50.84. Price is in the lower third, about $0.49 above the lower band. After Wednesday's expansion the bands are wide, and a walk down the lower band is possible. A bounce toward the midline is also possible. [Bearish]
- CMF (20): -0.137, below the -0.05 threshold. It improved from -0.414 on Oct 30 13:30, but it is still distribution and shows no sign of accumulation. [Distribution]
- ADX (14): 24.7 and rising, near the 25 threshold. −DI at 35.2 is well above +DI at 18.8, so bears are firmly in control. The trend is close to strong. [Strong Trend – Bearish]
- Volume: 6.13M on the latest bar, a notable uptick versus the recent quiet bars. The last bar closed green, which could be a small attempt at stabilization. Overall volume is not confirming a reversal. [Neutral-to-Bearish]
DIVERGENCES & TRENDS
- There is no clear bullish divergence yet. Price made lower lows on Oct 30 (49.85) while RSI made a low of 30.7, but the RSI and price lows are not clearly diverging.
- Most trend indicators agree on the downside. EMA13 is below EMA34, MACD crossed bearish, −DI is above +DI, and RSI has dropped from 72 to 35 within a day.
- Price is below the SMA200D ($54.95) and the SMA50D ($56.44). SMA50D is still above SMA200D, so there is no death cross, but the gap is narrowing. The long-term trend is damaged.
- Price is also below VWAP ($50.10), a minor negative.
- The last bars show a possible stabilization: price rose from 49.85 to 50.01, CMF improved from -0.414 to -0.137, and the final volume bar was green. This is early and needs follow-through.
- Wednesday's gap up to about $52 was completely retraced, which is a failed breakout and bearish.
CHART PATTERNS
- Price has been consolidating in a range of roughly $50.3–$51.3 for the past two weeks. It has now broken below the lower bound of that range, similar to a Bearish Rectangle/Descending Triangle breakdown. The reference diagram's Descending Triangle and Bearish Flag point lower.
- The gap-up spike on Oct 29 failed and reversed, similar to a bull trap.
- Measured move: the range height of about $1.0 implies a downside target of about $49.2–$49.4, near the lower Bollinger Band at $49.52.
- The prior low area near $49.8–$49.85 is the immediate support. It was the low on Oct 30 and sits just below the current price.
- Pattern invalidation is a reclaim of $50.70 or higher, which would put price back inside the range.
POTENTIAL SCENARIOS
- Scenario 1: Bearish Breakdown Continuation — Price breaks below the $49.85 low and drifts toward the lower Bollinger Band and the measured-move target. Bears control the DI lines and MACD is expanding downward. Trigger: a 1-hour close below $49.80. Target: $49.20–$49.50. Invalidation: a close above $50.70. (50% probability)
- Scenario 2: Neutral Oversold Bounce and Chop — RSI near 30 and the improving CMF produce a relief bounce toward EMA13 and VWAP, then price stalls. Trigger: hold above $49.80 with a push over $50.30. Target: $50.40–$50.75 (EMA13/EMA34). Invalidation: a break below $49.80. (30% probability)
- Scenario 3: Bullish Reversal — Dip buyers reclaim the former range and push through both EMAs. Trigger: a close above $50.75 on rising volume. Target: $51.30–$51.80. Invalidation: a failure back under $50.40. (20% probability)
PRICE TARGETS
For a 4-day timeframe the range should be about 4–8% of price, or roughly $2.00–$4.00 wide. The ATR of $0.32 implies a typical 4-day move of roughly $0.65, so I use a range near the lower end of that guidance, about $1.80 wide (3.6%).
- Target Price: $49.65 (4-day)
- Expected Range: $48.80 to $50.75 (width $1.95, about 3.9% of current price)
- Key Levels: Support at $49.52 (lower Bollinger Band, near the $49.85 swing low), Resistance at $50.44 (EMA 13, followed by EMA 34 at $50.73)
OVERALL BIAS
OVERALL BIAS: BEARISH - Price is below the EMAs, VWAP and both SMAs. MACD has crossed bearish, −DI (35.2) dominates +DI (18.8), CMF shows distribution, and the range has broken down. The oversold RSI may allow a bounce, but the weight of evidence favors a drift toward $49.5.
This is educational analysis and not financial advice.