BAC 48-day bullish forecast — Nov 15, 2026
- Bias: Bullish
- Timeframe: 48 days (made Nov 15, 2026, target date Jan 1, 2027)
- Price at analysis: $51.02
- Price target: $52.60
- Expected range: $48.40 – $55.60
- Result: Pending — graded after the close on Jan 1, 2027
Get a free AI analysis of BAC today
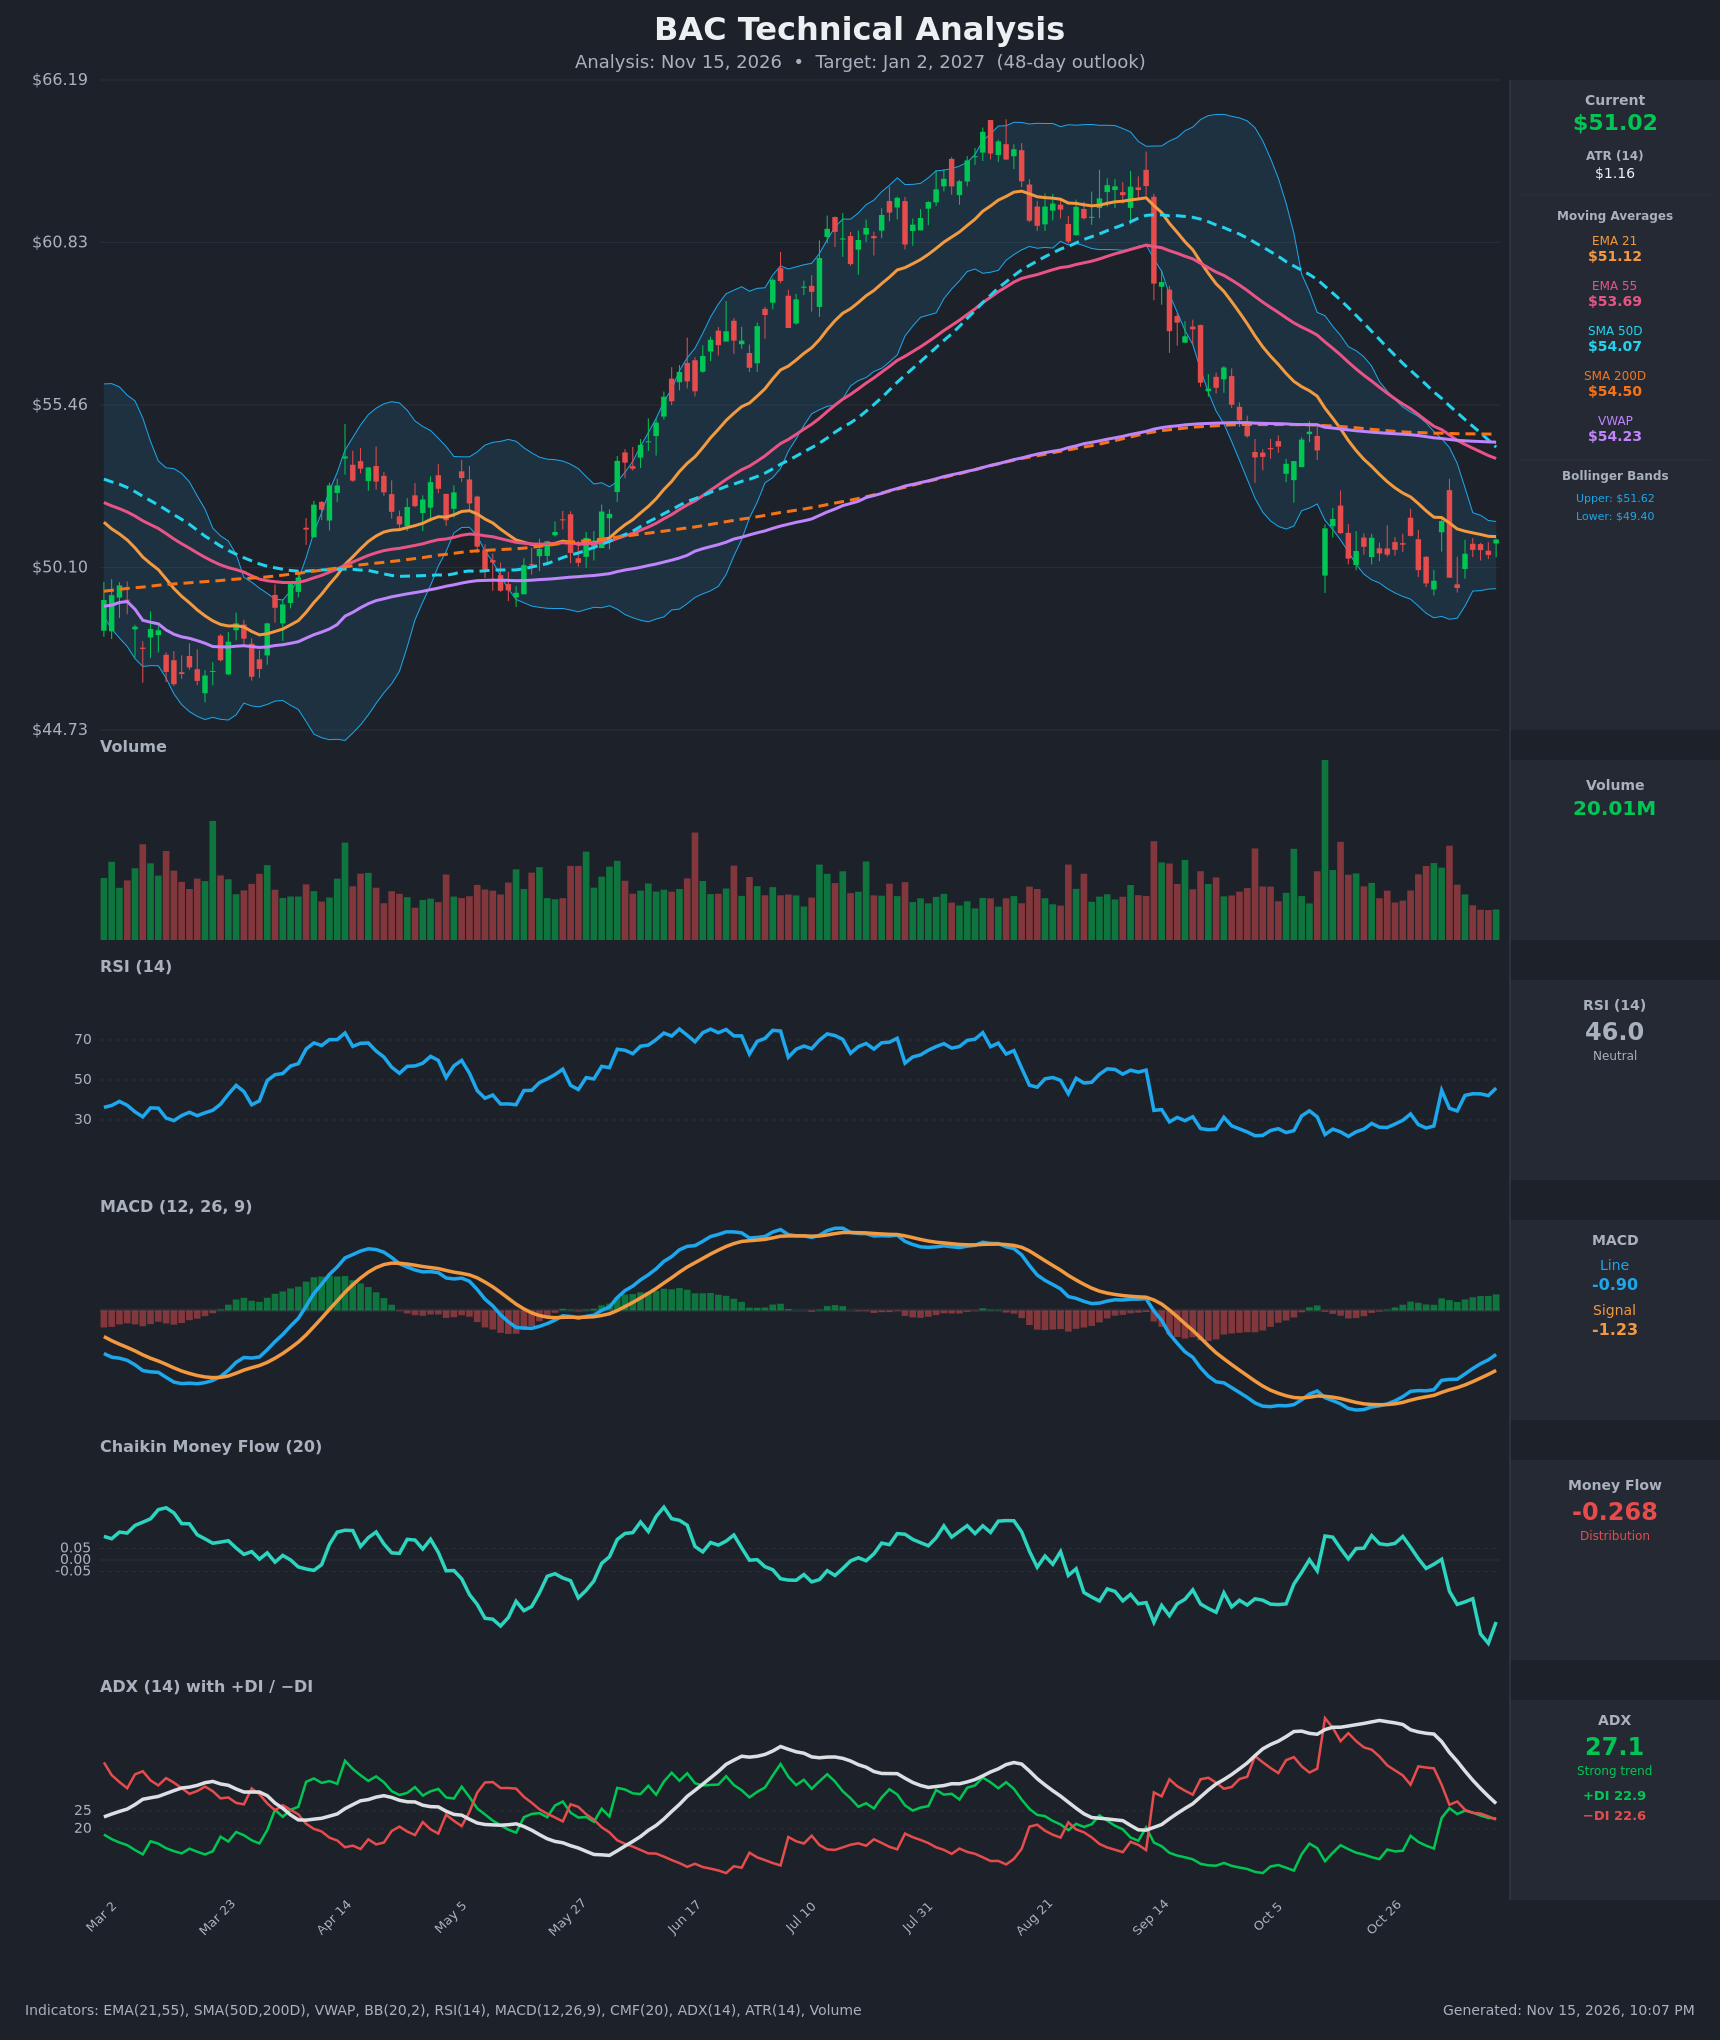
Analysis
TECHNICAL INDICATORS
- RSI (14): 45.96, up from a low of 26 on Nov 3 and making higher lows (26.2 → 34.5 → 46). It has recovered from oversold and is now just under the 50 midline, with momentum improving. [Bullish]
- 20 EMA: The EMA 21 is $51.12 and price ($51.02) sits right on it. The EMA 21 has been falling steadily, but its slope is flattening. Price is also below the EMA 55 ($53.69), SMA 50D ($54.07), SMA 200D ($54.50) and VWAP ($54.23), which are all overhead resistance. [Neutral]
- MACD: The line (-0.905) is above the signal (-1.234) after a bullish crossover in late October, and the histogram is positive and expanding. Both lines are still below zero, so this is a recovery inside a larger downtrend. [Bullish]
- Bollinger Bands (20): The bands are narrowing, with upper $51.62 and lower $49.40. Price is in the upper half of the bands and is not overextended. The squeeze points to a volatility expansion soon, and the direction is not yet set. [Neutral]
- CMF (20): -0.268 is deep distribution and has been falling from slightly positive in late October. Selling pressure is persistent even as price stabilizes, which is a warning. [Distribution]
- ADX (14): 27.1 and falling from 50. +DI (22.9) and −DI (22.6) have converged after −DI dominated the selloff. The downtrend is losing strength and bulls are only now reaching parity. [Weakening Trend, directionally balanced]
- Volume: 20.01M, with a heavy spike on the early-October capitulation and average-to-lower volume during the recent base. Contracting volume in the consolidation shows selling has been absorbed. There is no strong confirmation of a rally yet. [Neutral]
DIVERGENCES & TRENDS
- Bullish divergence: Price made equal or lower lows (about $49.57 and $49.42) while RSI and MACD made higher lows. Downside momentum has faded.
- CMF divergence: CMF is making new lows (-0.27) while price holds its range, which is a bearish divergence. This is the main contradiction in the setup.
- Moving averages: The SMA 50D ($54.07) is about to cross below the SMA 200D ($54.50), a death cross. It is a lagging signal after a 20% decline and is largely priced in. EMA 21 is well below EMA 55, which confirms the bearish structure.
- MACD: The bullish crossover is recent and the histogram is rising.
- ADX and DI: The DI lines have converged, a possible regime change from bearish to neutral.
- Price vs. long-term averages: Price is below the SMA 200D, so the long-term trend remains down until $54.50 is reclaimed.
CHART PATTERNS
- Bullish Double Bottom (reversal): Lows at about $49.57 (Nov 2) and $49.42 (Nov 6) sit near $49.40. The neckline is around $51.6–51.7, the Nov 4 high and upper Bollinger Band. A close above it would project to about $53.8 (neckline plus roughly $2.2 pattern height), which lines up with the EMA 55 and SMA 50D.
- Bearish flag/pennant (continuation): The tight consolidation after the sharp drop from about $60 to $50 could also resolve lower. A break below $49.40 would project toward $47 or lower.
- The double bottom is slightly favored because of the momentum divergences, but it is not confirmed until the neckline breaks.
POTENTIAL SCENARIOS
- Scenario 1: Bullish Double-Bottom Breakout and Mean Reversion — Price breaks the neckline near $51.65, then grinds toward the falling cluster of EMA 55, SMA 50D and VWAP at about $53.7–54.2. Trigger: daily close above $51.65 with MACD continuing to rise and CMF turning up. Target: $53.70–$54.20. Invalidation: close below $49.40. (50% probability)
- Scenario 2: Bearish Range Breakdown / Death Cross Continuation — The base fails as CMF distribution and the death cross pull price down, and the flag resolves lower. Trigger: close below $49.40 on rising volume. Target: $47.00–$48.00. Invalidation: close above $52.00. (33% probability)
- Scenario 3: Neutral Range-Bound Chop — Price oscillates between $49.40 and $51.65 with fading ADX. Trigger: repeated failures at both range edges. Target: $50–$52. Invalidation: a decisive close outside $49.40–$51.65. (17% probability)
PRICE TARGETS
- Target Price: $52.60 (48-day horizon)
- Expected Range: $48.40 to $55.60 (width $7.20, about 14.1% of the current price, within the 12–18% guidance for 30–60 days)
- Key Levels: Support at $49.40, Resistance at $53.70
OVERALL BIAS
OVERALL BIAS: BULLISH - Bullish divergences on RSI and MACD, a double-bottom base near $49.40, a MACD bullish crossover and fading bearish ADX momentum favor a rebound toward the $53–54 moving-average cluster. Persistent CMF distribution and the pending death cross keep conviction modest.
This is educational analysis and not financial advice.