BAC 27-day bullish forecast — Nov 15, 2026
- Bias: Bullish
- Timeframe: 27 days (made Nov 15, 2026, target date Dec 11, 2026)
- Price at analysis: $51.02
- Price target: $52.90
- Expected range: $48.40 – $55.40
- Result: Pending — graded after the close on Dec 11, 2026
Get a free AI analysis of BAC today
Analysis
TECHNICAL INDICATORS
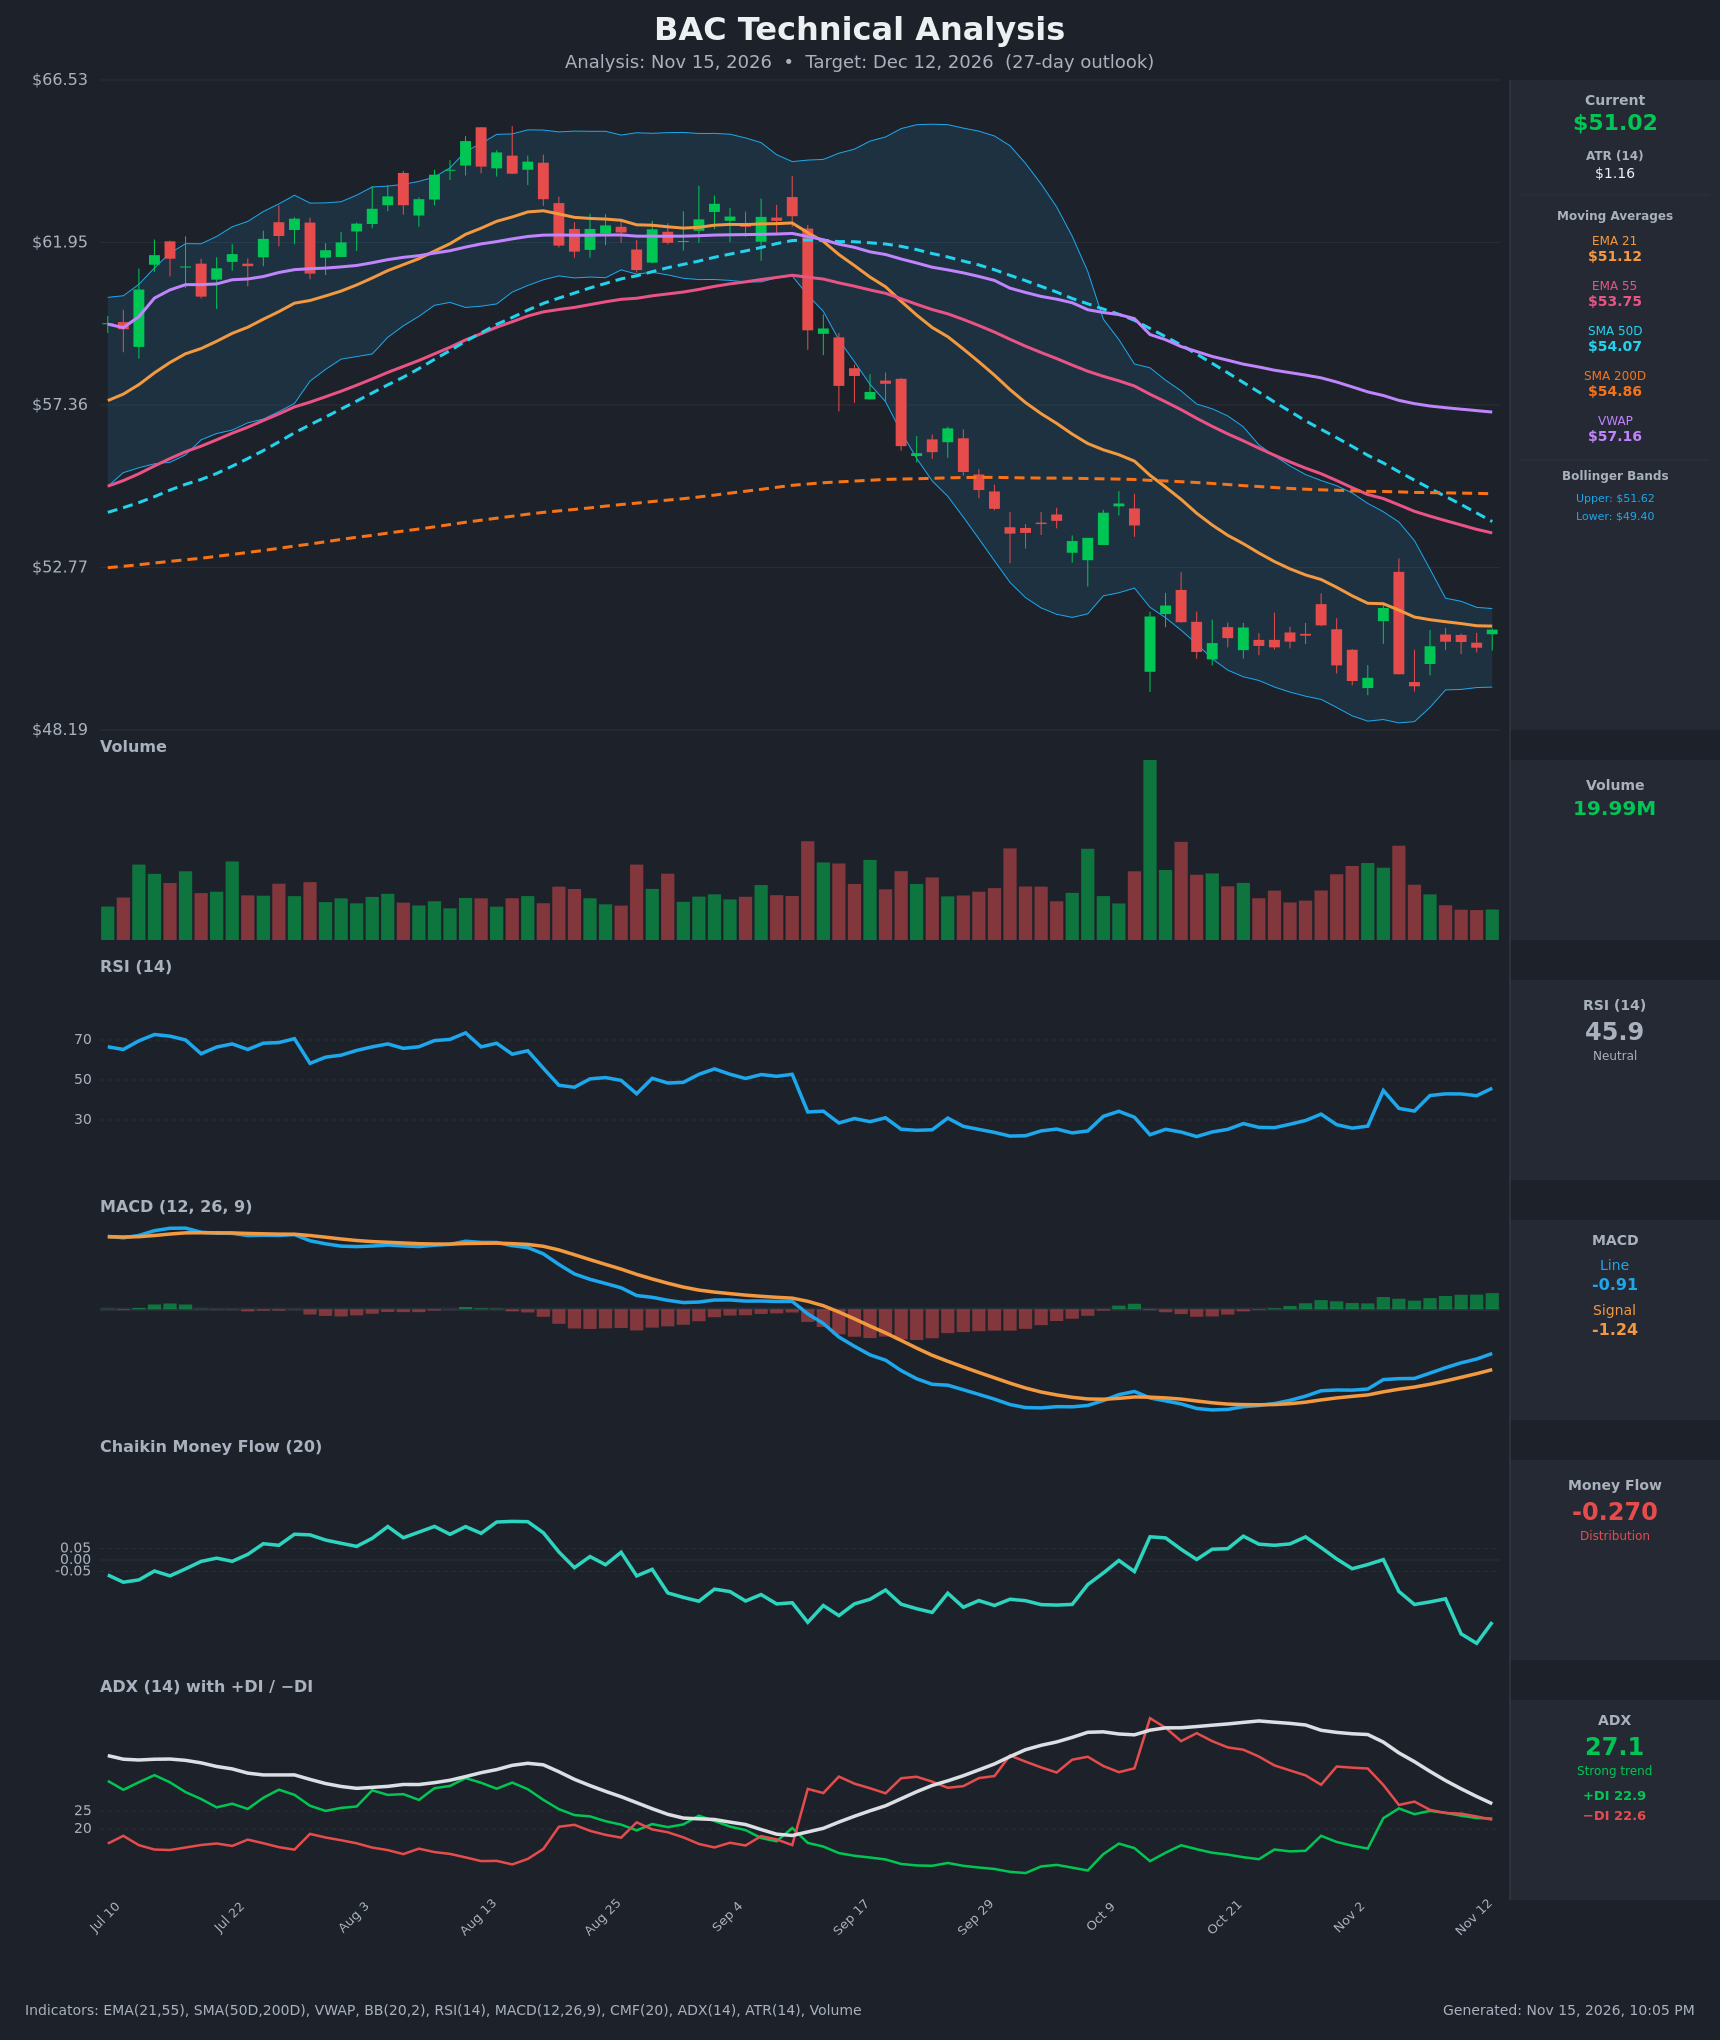
- RSI (14): 45.9, up from a 25.9 low on Nov 2 and back above the 30-40 oversold zone. It is now approaching the midline, so downside momentum has faded and the trend of readings is up. [Bullish]
- 20 EMA (EMA 21): $51.12, with price at $51.02 sitting essentially on it. The EMA21 is still sloping down and sits well below the EMA55 ($53.75), SMA50 ($54.07), SMA200 ($54.86) and VWAP ($57.16). The EMA21 is the first resistance, and a close above it would be the first sign of recovery. [Neutral]
- MACD: Line -0.91 is above the signal at -1.24, a bullish crossover that occurred around Oct 29-Nov 4. The histogram is positive and growing, but both lines are still well below zero, so this is a counter-trend recovery rather than a confirmed reversal. [Bullish]
- Bollinger Bands (20): Upper $51.62, lower $49.40. The bands have narrowed sharply from the September-October expansion, which points to a volatility squeeze and consolidation. Price is in the upper half of the band after walking the lower band for weeks. A close above $51.62 would be an upside range break. [Neutral]
- CMF (20): -0.270, deep distribution and falling again from about -0.04 in early November. Selling pressure is heavy and does not confirm the price and momentum bounce. This is the main bearish warning. [Distribution]
- ADX (14): 27.1 and falling quickly from 50. +DI is 22.9 and −DI is 22.6, so the DIs have converged after −DI dominated for months. The downtrend is exhausting, and a clean +DI cross above −DI would be a bullish control shift. [Weakening Trend, direction undecided]
- Volume: 19.99M, quiet and drying up in recent sessions after the Oct 9 capitulation spike. Selling volume has faded while price holds the $49.4-$51.6 zone, which is consistent with a base forming but not yet showing accumulation. [Neutral / selling exhaustion]
DIVERGENCES & TRENDS
- Bullish divergence: Price made lows at $49.57 (Nov 2) and $49.42 (Nov 6), roughly equal to the early-October lows. RSI (25.9 → 34.5) and MACD (-1.94 → -0.91) made higher lows, so downside momentum is shrinking.
- Bearish contradiction: CMF diverges the other way. It is making new lows (-0.362) while price holds, which shows persistent distribution.
- Crossovers:
- The MACD bullish crossover has happened.
- The EMA21 is below the EMA55, the SMA50 is below the SMA200 (death cross already in place), and price is below the SMA200. The long-term trend is still down.
- The EMA21 is flattening, and price has hovered around it for several sessions.
- ADX/DI: ADX is falling from an extreme reading and the DIs are converging, so the trend is exhausting rather than accelerating.
- Price vs. VWAP: Price is about 11% below VWAP ($57.16), so the market is deeply discounted relative to the average cost basis. Overhead supply is heavy.
CHART PATTERNS
- Bullish Triple Bottom (diagram's "Bullish Triple Top" pattern): Price has tested the $49.4-$49.6 area three times (early October, Nov 2, Nov 6) and bounced each time. The neckline is around $51.6-$52.8. A confirmed break targets about $54-$55, the measured move plus the EMA55/SMA50 cluster.
- Possible Bullish Falling Wedge / Symmetrical consolidation: Lower highs and flattening lows since mid-October, with a Bollinger squeeze. It is a bullish reversal setup if price breaks above the $51.6-$52.5 area.
- Bearish risk: If the base fails, the prior decline from about $64 would resume as a bearish continuation or flag. A close below $49.4 would break the triple-bottom support, and the measured target would then be about $46-$47.
POTENTIAL SCENARIOS
- Scenario 1: Bullish Base Breakout and Mean-Reversion Bounce — Momentum is turning up (MACD cross, RSI rising, DI convergence), selling volume is drying up, and the $49.4 support has held three times. Price clears the squeeze and heads toward the falling moving averages. Trigger: daily close above $51.62 (BB upper) and then above about $52.5 with +DI crossing above −DI. Target: $52.90 to $54.00 (EMA55/SMA50 zone). Invalidation: daily close below $49.40. (45% probability)
- Scenario 2: Bearish Support Breakdown — CMF distribution and the price below every major moving average show that sellers remain in control, and the bounce stalls under the $51.6-$54 resistance. A break of the triple bottom resumes the downtrend. Trigger: daily close below $49.40 on rising volume, with −DI crossing back above +DI. Target: $47.00-$48.20. Invalidation: close above $53.75 (EMA55). (35% probability)
- Scenario 3: Neutral Range Chop — Price oscillates between $49.40 and $52.50 as the squeeze resolves slowly and ADX falls below 20. Trigger: failed breaks of both $49.40 and $52.50. Target: $50.00-$51.50. Invalidation: decisive close outside $49.0-$53.0. (20% probability)
PRICE TARGETS
Range width check: $55.40 − $48.40 = $7.00, which is 13.7% of $51.02. That fits the 30-60 day guidance of 12-18% and is appropriate for a 27-day horizon.
- Target Price: $52.90 (27-day horizon, about +3.7% from current)
- Expected Range: $48.40 to $55.40
- Key Levels: Support at $49.40 (triple-bottom base and lower Bollinger Band), Resistance at $53.75 (EMA55; minor resistance at $51.62 BB upper and $52.50 neckline)
OVERALL BIAS
OVERALL BIAS: BULLISH - Price is holding a triple-bottom base at $49.4 with a bullish MACD crossover, rising RSI, converging DIs and fading selling volume. The target is a rebound toward the EMA55/SMA50 area. Conviction is modest because CMF shows heavy distribution and the long-term trend is still down.
This is educational analysis and not financial advice.