BAC 83-day bullish forecast — Nov 15, 2026
- Bias: Bullish
- Timeframe: 83 days (made Nov 15, 2026, target date Feb 5, 2027)
- Price at analysis: $51.02
- Price target: $53.20
- Expected range: $46.00 – $57.50
- Result: Pending — graded after the close on Feb 5, 2027
Get a free AI analysis of BAC today
Analysis
TECHNICAL INDICATORS
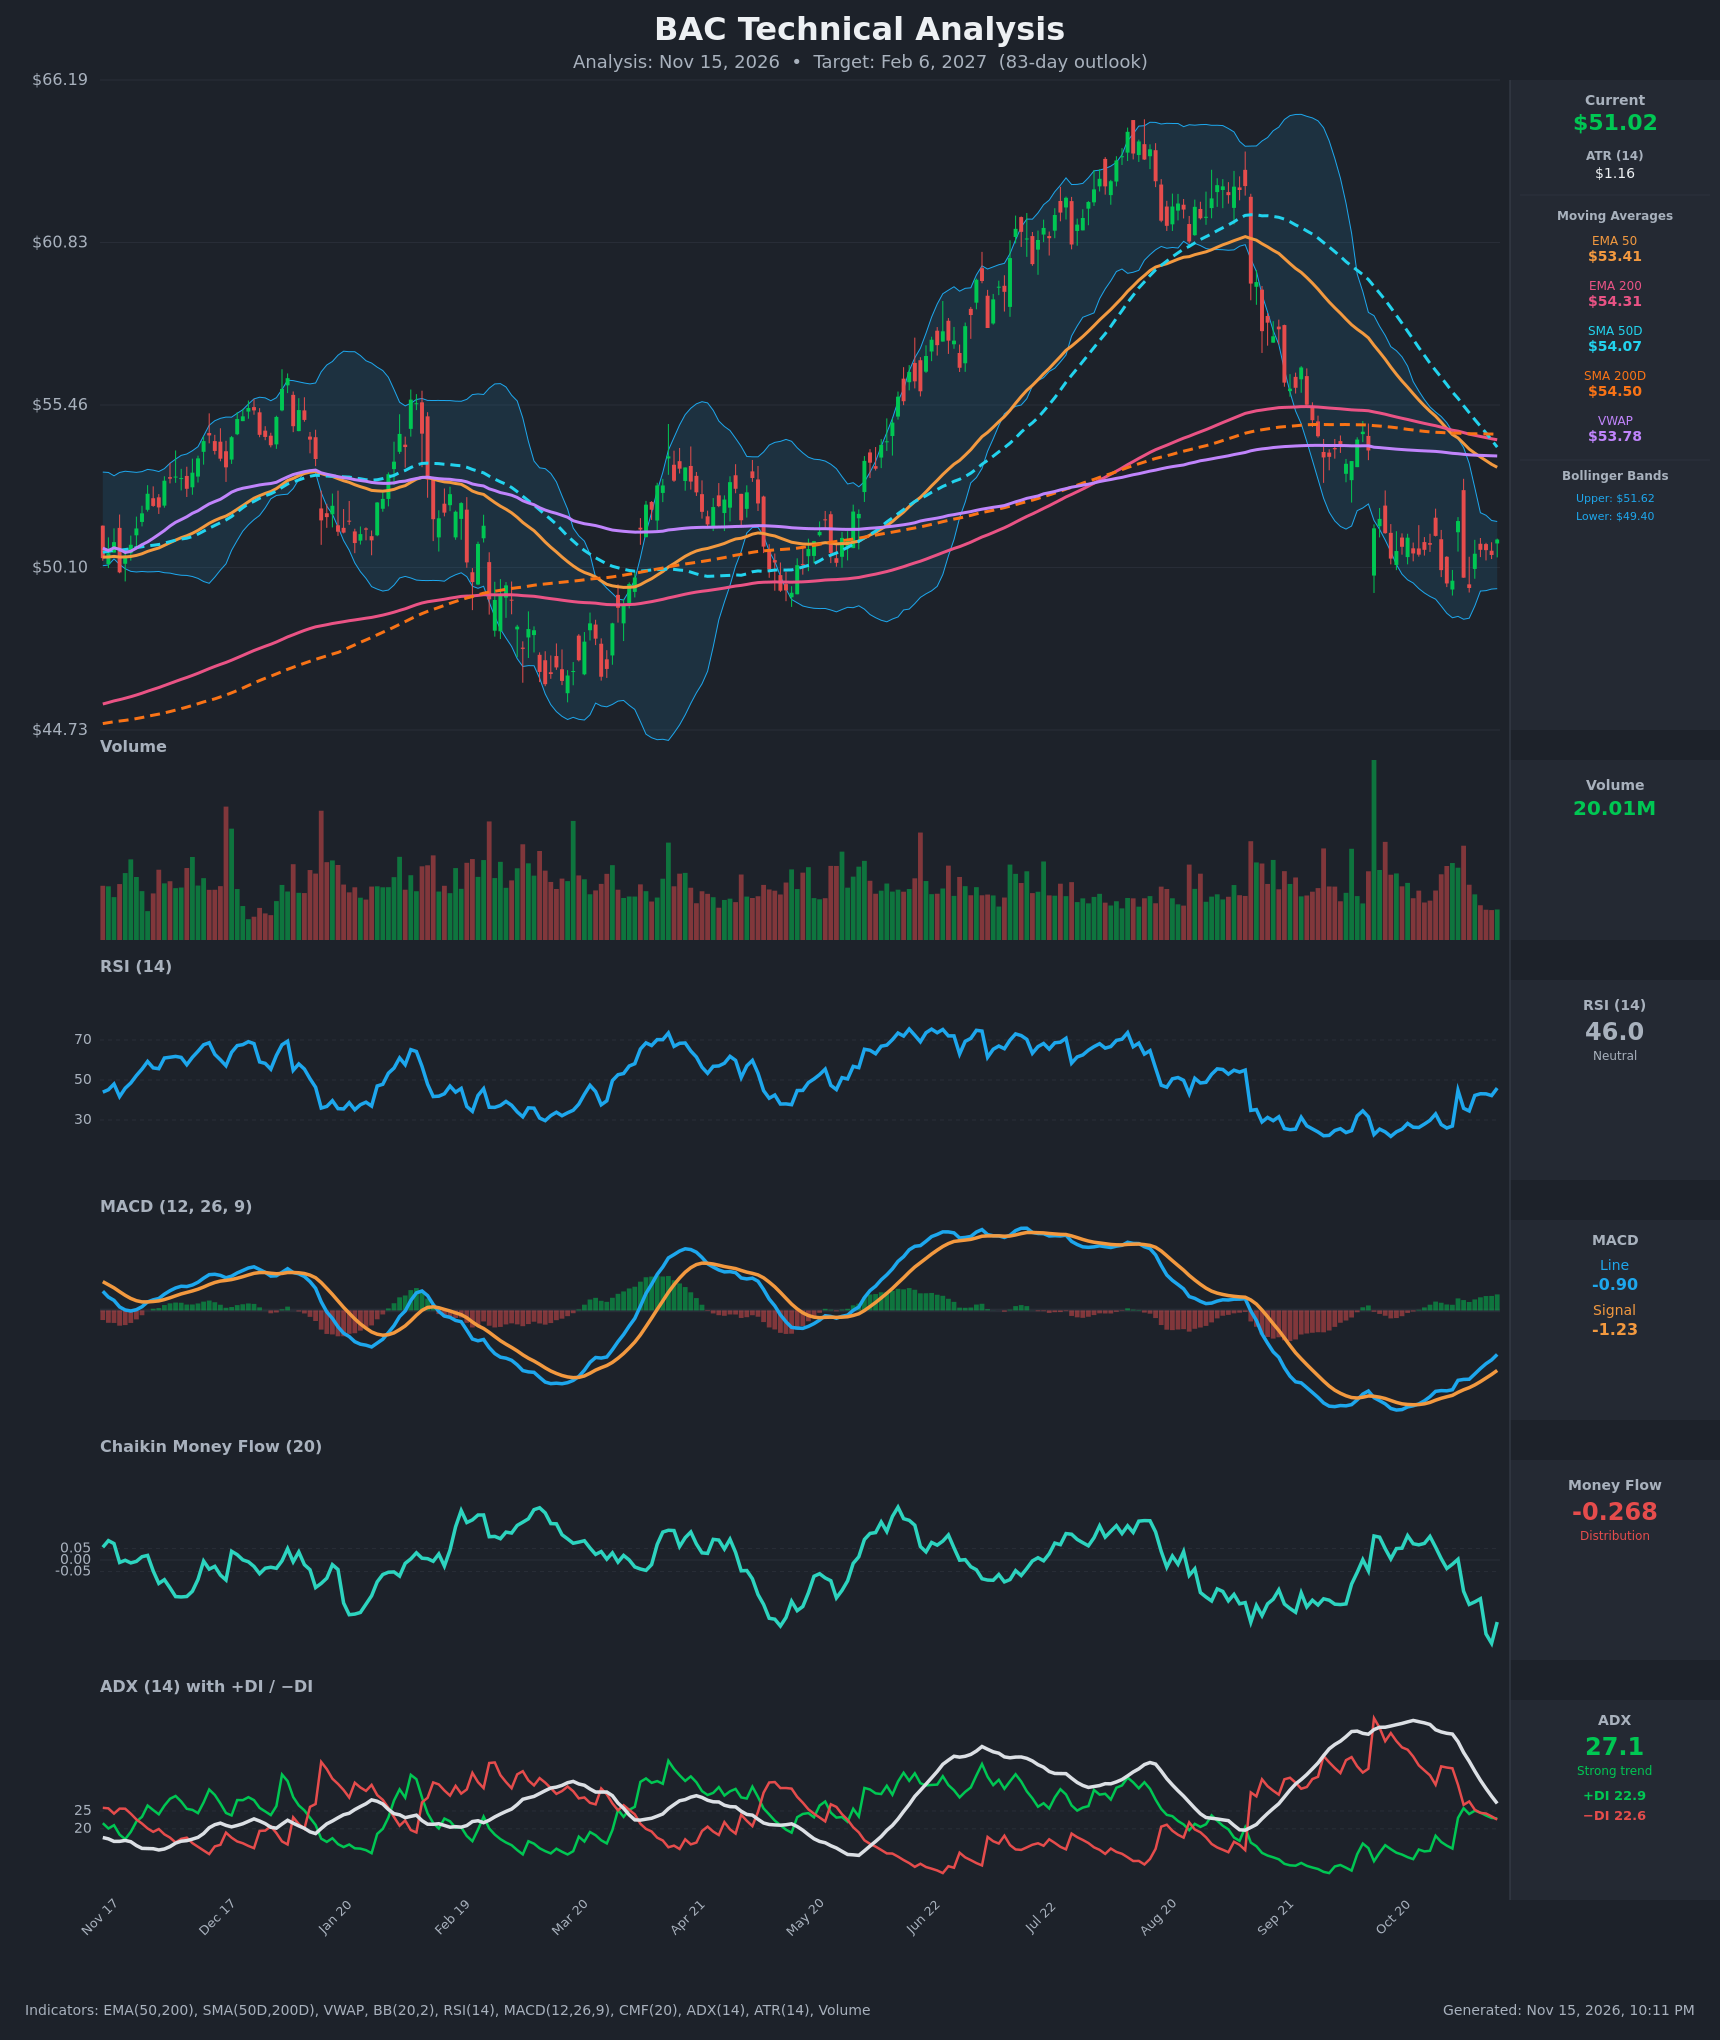
- RSI (14): 45.96, up from the 26–28 oversold readings in late October and early November. It has made a higher low and is back near the 50 midline, so momentum is recovering but not yet confirmed. [Neutral]
- 20 EMA: The 20 EMA is not provided, but the table shows price rising off the lows and sitting at the upper Bollinger midline area. Price ($51.02) is below EMA50 ($53.41), EMA200 ($54.31), SMA50D ($54.07), SMA200D ($54.50) and VWAP ($53.78). All of these now act as overhead resistance. [Bearish]
- MACD: The line (-0.905) is above the signal (-1.234), and the histogram is positive and widening. The line crossed above the signal around Oct 26 and has kept converging. Both lines are still below zero, so this is an early recovery from a deeply negative reading. [Bullish]
- Bollinger Bands (20): Price ($51.02) is in the upper half of the bands ($49.40 lower, $51.62 upper). The bands have narrowed after the sell-off, which points to compression and a coming volatility expansion. The Nov 6 low at $49.42 sat right on the lower band and held. [Neutral]
- CMF (20): -0.268 is a sharp deterioration from +0.07 two weeks ago and the weakest reading on the chart. This is heavy distribution, and it contradicts the price bounce. [Distribution]
- ADX (14): 27.1 and falling from 50. +DI (22.9) and −DI (22.6) have converged after −DI dominated the decline, so the bearish trend is losing strength and the DIs are on the verge of a bullish crossover. [Weak Trend, fading bearish]
- Volume: 20.01M, roughly average. Volume was lighter on the recent bounce and heavy on the September breakdown spike, so there is no strong conviction on the upside yet. [Neutral]
DIVERGENCES & TRENDS
- Bullish divergence: Price made a marginal low at $49.42 (Nov 6) versus $49.57 (Nov 2). RSI rose from 26 to 34.5 and now sits at 46, and MACD made higher lows.
- Bearish divergence: CMF is falling to its lowest reading while price bounces, so the rebound is not backed by buying pressure.
- Death cross pending: EMA50 has been below EMA200 since early November. SMA50D ($54.07) is about to cross below SMA200D ($54.50), which is a lagging bearish signal. By then price is already well below both averages.
- ADX: It has fallen from 50 to 27, which signals trend exhaustion. The DI lines are about to cross.
- MACD: It crossed above the signal line, with the histogram turning positive and expanding.
CHART PATTERNS
- Bullish double bottom (reversal): The lows near $49.4–$49.6 on Oct 30–Nov 3 and Nov 6 form a base. The neckline is around $51.6–$51.7 (the Nov 4 high and upper Bollinger Band). A close above it targets about $53.8–$54.0 (measured move of roughly $2.2), which coincides with the SMA50D/SMA200D/VWAP cluster.
- Broader context: Price fell from about $63 to $50 after a lower-high rollover in August. The earlier $45–$55 range sets the longer-term floor and ceiling.
- Risk to the pattern: If price loses $49.40, the double bottom fails. The next support is around $47 and then $45.
POTENTIAL SCENARIOS
- Scenario 1: Bullish Double-Bottom Recovery — MACD is turning up, RSI is recovering and the DIs are about to cross bullish. Price breaks the $51.65 neckline and fills the gap up to the declining moving-average cluster. Trigger: daily close above $51.70 on rising volume. Target: $53.40–$54.50. Invalidation: close below $49.40. (45% probability)
- Scenario 2: Bearish Breakdown / Death Cross Continuation — CMF distribution persists, the SMA50/SMA200 death cross completes and rallies fail at the $53.4–$54.5 resistance cluster. Price loses the double-bottom lows and heads for the prior range floor. Trigger: close below $49.40. Target: $46.50–$47.50. Invalidation: close above $54.50. (35% probability)
- Scenario 3: Neutral Range Chop — Price stays between $49.40 and $53.40 as the DIs intertwine and ADX fades. Trigger: repeated rejections near $51.6–$53.4 with no breakout. Target: $50–$52. Invalidation: a decisive break either side of the range. (20% probability)
PRICE TARGETS
- Target Price: $53.20 (83 days; the double-bottom measured move and mean reversion toward the declining moving-average cluster)
- Expected Range: $46.00 to $57.50 (width $11.50, about 22.5% of the current price, in line with the 61–180 day guidance of 18–30%)
- Key Levels: Support at $49.40, Resistance at $53.41
OVERALL BIAS
OVERALL BIAS: BULLISH - A double-bottom base at $49.4–$49.6, a bullish MACD crossover, RSI recovering from oversold, and ADX fading with the DIs converging favor a mean-reversion rally toward $53–$54. Strongly negative CMF and the pending death cross cap conviction, and a close below $49.40 would invalidate the call.
This is educational analysis and not financial advice.