BAC 20-day bullish forecast — Nov 15, 2026
- Bias: Bullish
- Timeframe: 20 days (made Nov 15, 2026, target date Dec 4, 2026)
- Price at analysis: $51.02
- Price target: $52.40
- Expected range: $49.20 – $54.40
- Result: Pending — graded after the close on Dec 4, 2026
Get a free AI analysis of BAC today
Analysis
TECHNICAL INDICATORS
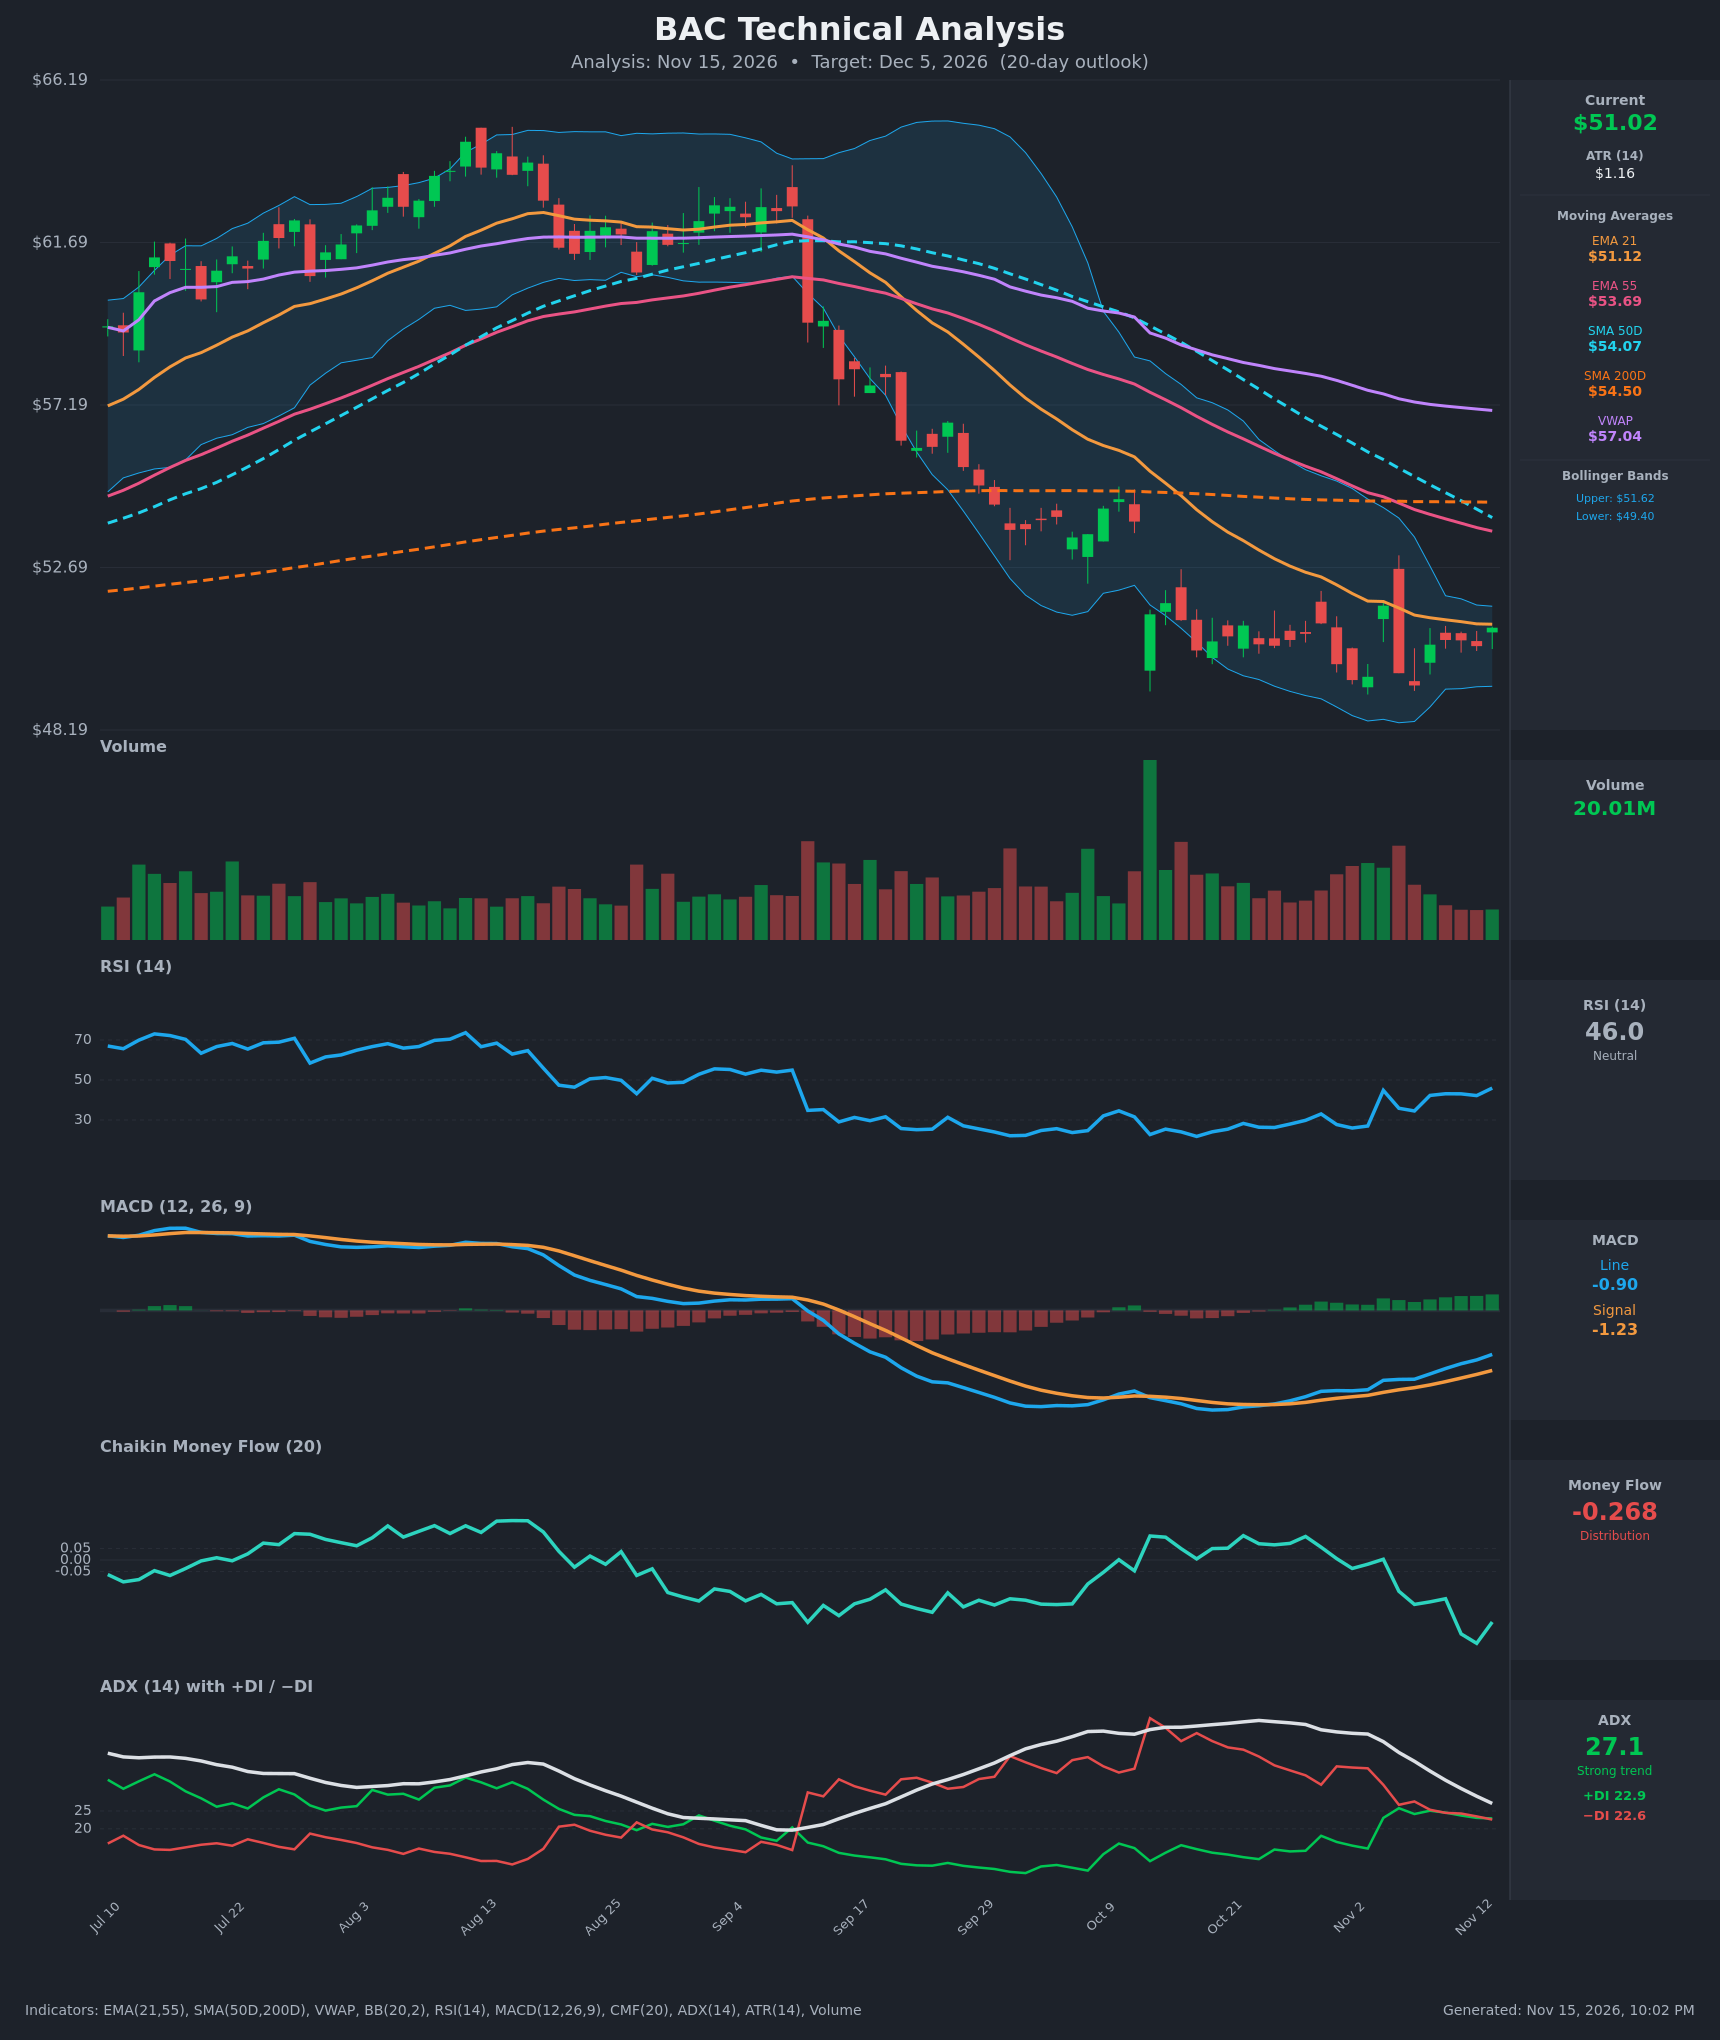
- RSI (14): 45.96, up from a low of 26 on Nov 2 and making higher lows. It has moved out of oversold and is back near the midline. Momentum is recovering but not yet strong. [Bullish]
- 20 EMA: The EMA21 is $51.12 and price ($51.02) sits right on it. The EMA21 is still sloping down and is well below the EMA55 ($53.69), so it works as near-term resistance. Price has not closed decisively above it. [Neutral]
- MACD: The line is -0.905 and the signal is -1.234. The line crossed above the signal in late October, and the histogram is positive and expanding. The whole indicator is still below zero, so this is a recovery from deeply negative territory rather than a confirmed trend change. [Bullish]
- Bollinger Bands (20): The bands are $49.40 to $51.62 and have narrowed sharply after the selloff. Price is in the upper half, near the upper band at $51.62, after repeatedly defending the lower band around $49.4–49.6. The squeeze points to an upcoming volatility expansion, direction unconfirmed. [Neutral]
- CMF (20): -0.268 and falling again after a brief bounce. This is heavy distribution and a clear negative divergence against the price stabilization. [Distribution]
- ADX (14): 27.1 and falling from 50. The trend is losing strength. +DI (22.9) and −DI (22.6) have converged after −DI dominated for weeks, and +DI is now marginally on top. [Weakening Trend, direction neutral to slightly bullish]
- Volume: 20.01M, below the recent spikes (the capitulation bar in mid-October and the Nov 4 bounce). Volume has dried up during the basing, which means selling pressure is fading but buyers are not stepping in aggressively either. [Neutral]
DIVERGENCES & TRENDS
- Bullish momentum divergence: price made a lower low on Nov 6 ($49.42) while RSI (34.5) held far above its October low (26), and MACD has been rising steadily since mid-October.
- Bearish money-flow divergence: CMF is making new lows (-0.268) even as price holds up. Volume-weighted flow does not confirm the bounce.
- Moving averages: a death cross has just occurred, with the SMA50D ($54.07) below the SMA200D ($54.50). Price is below the EMA55, SMA50, SMA200 and VWAP ($57.04). The long-term trend is still down, and these averages (about $53.7–$54.5) form a stacked resistance zone.
- Trend strength: ADX is falling from 50 and the DI lines have converged. The downtrend is exhausting, and the market is transitioning to basing or range behavior.
- Crossovers: MACD is above its signal (bullish). +DI has just crossed above −DI (marginal). Price is testing the EMA21 from below.
CHART PATTERNS
- Bullish Double Bottom (reversal): lows near $49.4–49.6 (Oct 30–Nov 2 and Nov 6) with a neckline around $51.6 (the Nov 4 spike high and upper Bollinger Band). A close above $51.65 on volume would project a measured move of roughly $2.2 to about $53.8, which lines up with the EMA55 at $53.69.
- Possible Bearish Flag or Pennant: the tight, low-volume consolidation after the steep drop from $63 to $49 could also resolve downward. A break below $49.40 would target about $47–47.5, based on the flag height.
- The converging Bollinger Bands and low volume support an imminent breakout. The double bottom, RSI and MACD give a slight edge to the upside, but the CMF and the MA stack argue for caution.
POTENTIAL SCENARIOS
- Scenario 1: Bullish Double-Bottom Breakout and Mean-Reversion Bounce — Price clears the neckline and the EMA21 and squeezes toward the declining EMA55 as MACD and RSI keep recovering. Trigger: daily close above $51.65 with volume above about 25M. Target: $52.40 initially, then $53.70 (EMA55 and measured move). Invalidation: close below $49.40. (45% probability)
- Scenario 2: Bearish Distribution Breakdown — Persistent negative CMF proves right, the bounce fails at the EMA21 and the $51.6 band, and price loses the $49.4 support to resume the downtrend. Trigger: close below $49.40. Target: $47.50. Invalidation: close above $52.00. (35% probability)
- Scenario 3: Neutral Range Chop — Price stays between $49.4 and $51.8 as ADX fades and the bands remain tight. Trigger: repeated rejections at $51.6 and bounces at $49.5. Target: $50–51. Invalidation: a decisive close outside the range. (20% probability)
PRICE TARGETS
- Target Price: $52.40 (20-day, Dec 5, 2026)
- Expected Range: $49.20 to $54.40 (width $5.20, about 10.2% of the current price, consistent with the 14–21 day guidance)
- Key Levels: Support at $49.40, Resistance at $53.69 (first hurdle at $51.62)
OVERALL BIAS
OVERALL BIAS: BULLISH - Momentum is recovering (RSI higher lows, MACD above its signal with a positive histogram), a double-bottom base has formed at $49.4–49.6, and the ADX and DI readings show the downtrend exhausting. The upside is capped by the stacked moving averages and the very negative CMF, so conviction is modest.
This is educational analysis and not financial advice.