BAC 34-day bullish forecast — Nov 15, 2026
- Bias: Bullish
- Timeframe: 34 days (made Nov 15, 2026, target date Dec 18, 2026)
- Price at analysis: $51.02
- Price target: $52.80
- Expected range: $48.50 – $56.00
- Result: Pending — graded after the close on Dec 18, 2026
Get a free AI analysis of BAC today
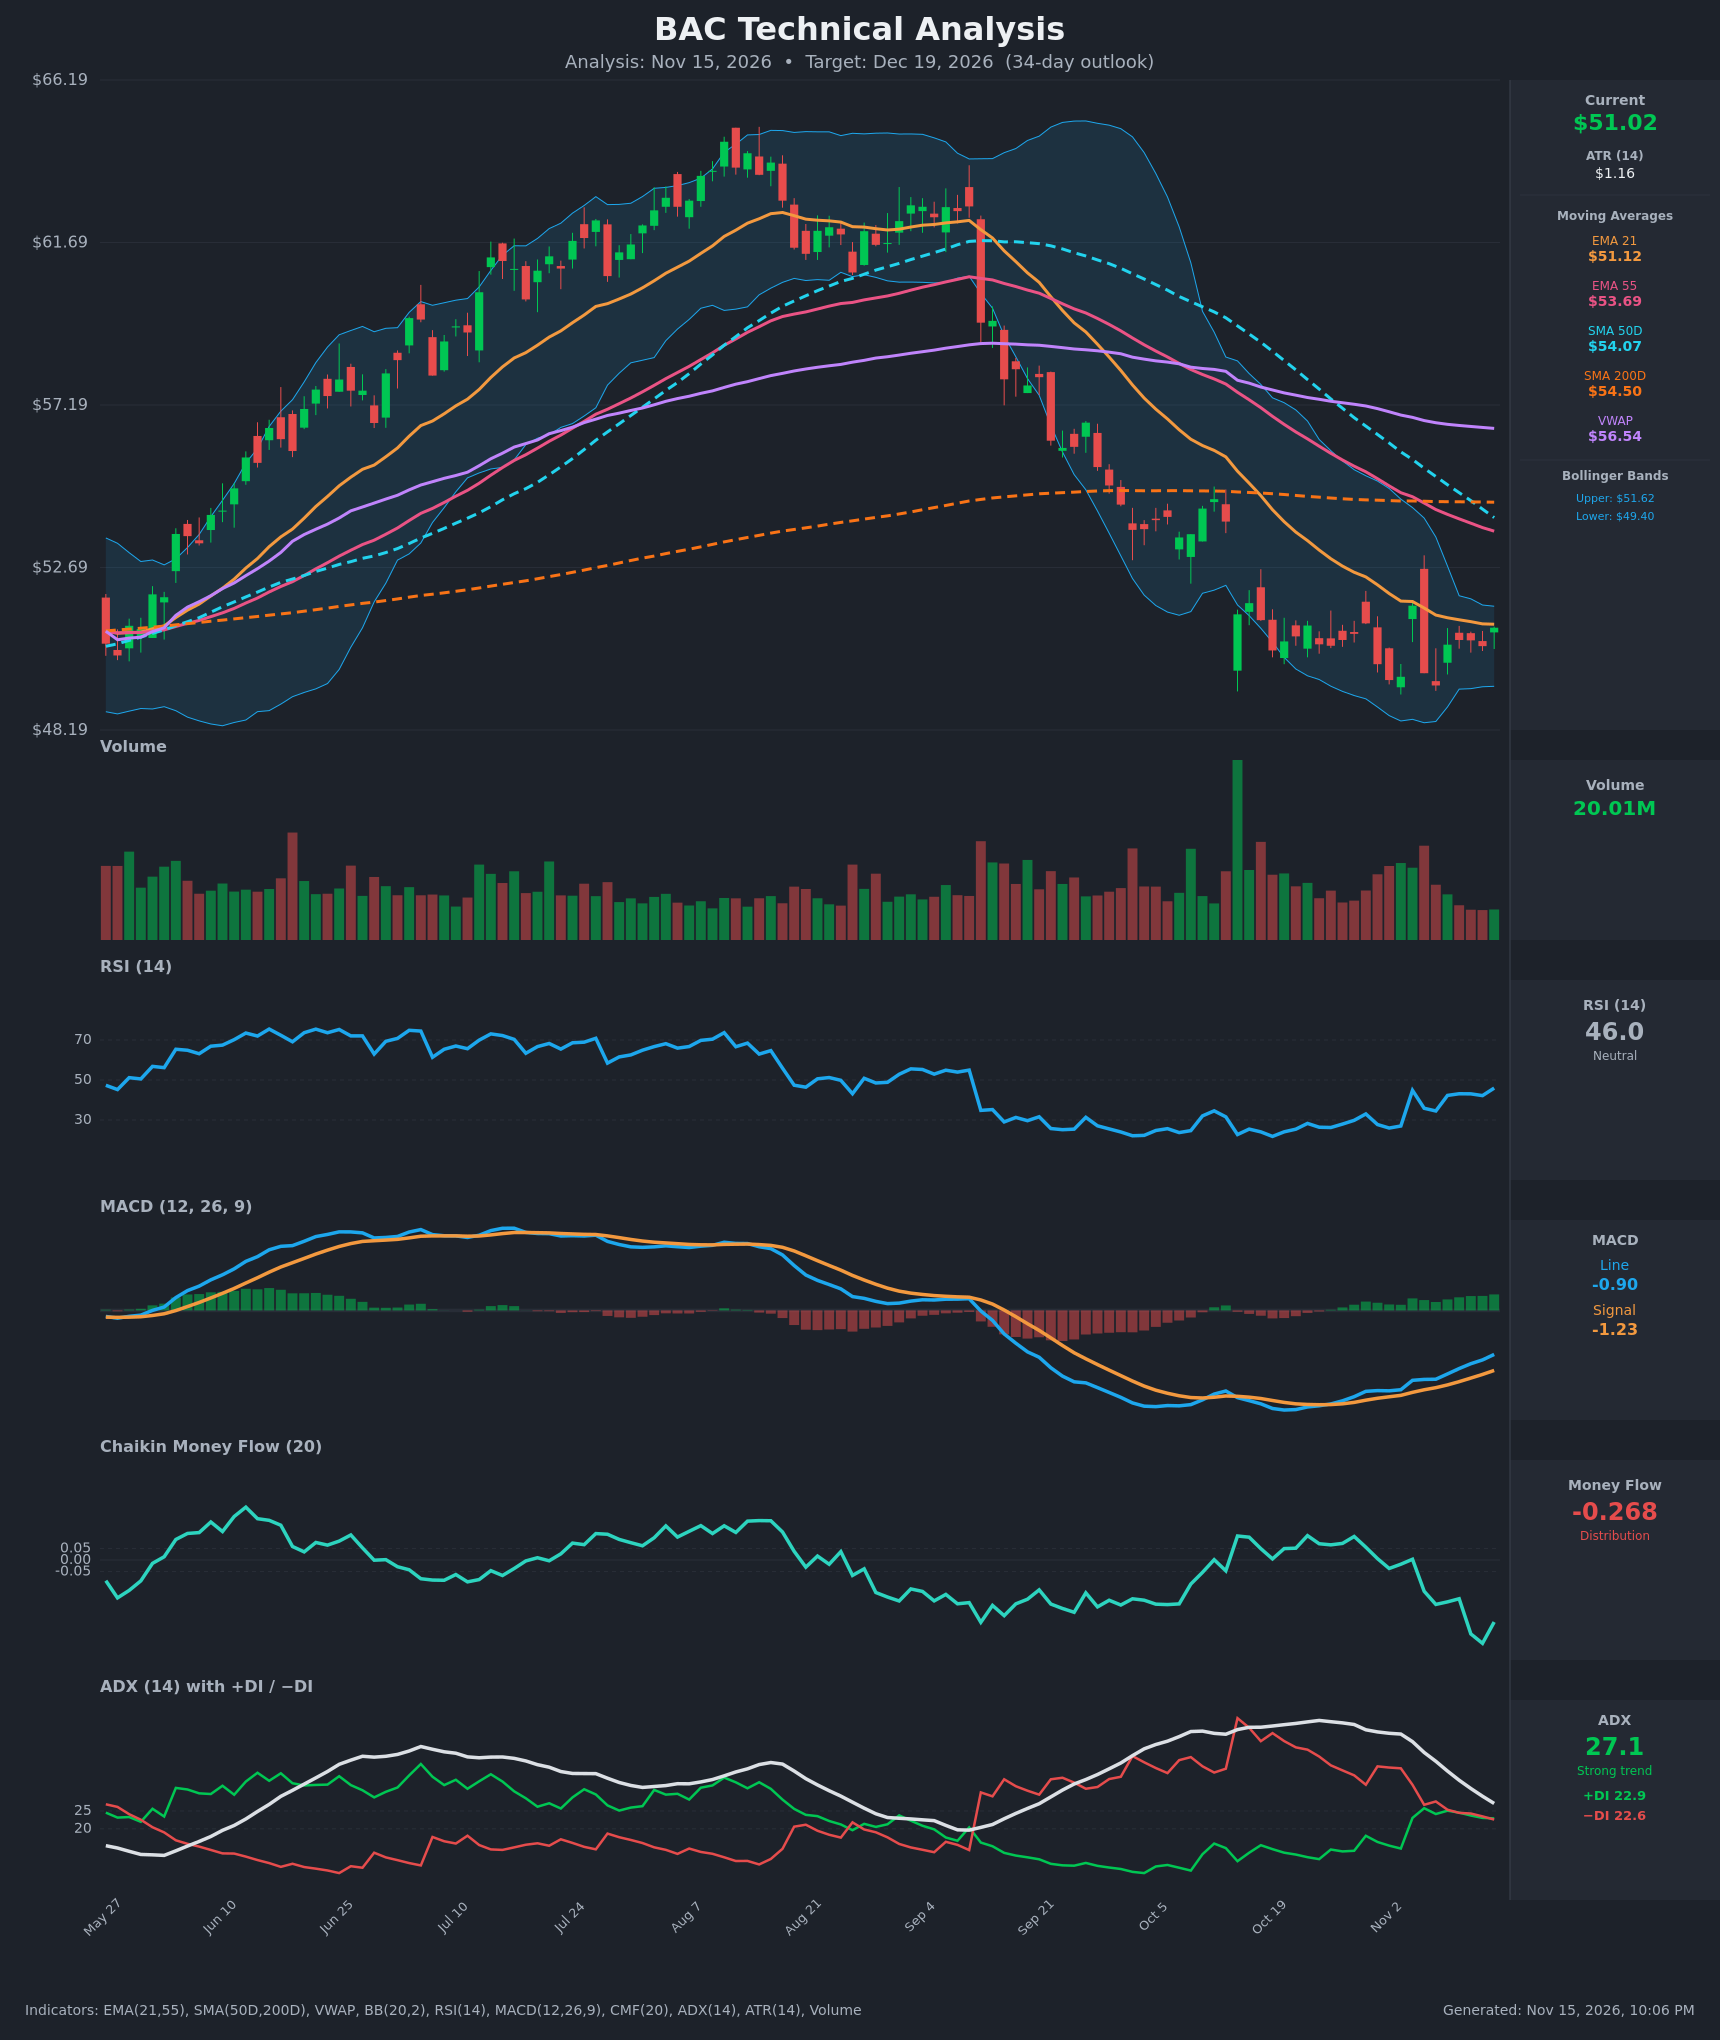
Analysis
TECHNICAL INDICATORS
- RSI (14): 45.96, up from the 26–28 oversold zone in late October and early November. It has made higher lows and is approaching the 50 midline. Momentum is improving but has not yet confirmed a trend change. [Neutral]
- 20 EMA: The 21 EMA is $51.12 and price ($51.02) is sitting right on it. Price has failed to hold above it on closing bases since September, so it acts as immediate resistance. Price is also below EMA55 ($53.69), SMA50D ($54.07) and SMA200D ($54.50), and VWAP ($56.54) is far overhead. [Bearish]
- MACD: The MACD line (-0.905) crossed above the signal (-1.234) in early November, and the histogram has been positive and expanding for several sessions. The line is still deeply below zero, so this is a recovery from oversold rather than a confirmed uptrend. [Bullish]
- Bollinger Bands (20): Upper band is $51.62 and lower band $49.40, so the bands are very narrow (a squeeze). Price is in the upper half near the mid-band (~$50.5). The squeeze points to an upcoming volatility expansion, but the direction is not signaled. [Neutral]
- CMF (20): -0.268, a sharp drop from about +0.07 in late October. This is the strongest selling-pressure reading on the chart, and it is falling even as price stabilizes. That is a warning against trusting the bounce. [Distribution]
- ADX (14): 27.1 and falling from 50. +DI (22.9) and −DI (22.6) have converged after −DI dominated for weeks. The prior downtrend is losing strength and bears no longer clearly control. [Weakening Trend, direction undecided]
- Volume: 20.01M, below average and drying up during the consolidation, apart from the Nov 4 spike and reversal. Low volume on the base suggests selling exhaustion but no aggressive buying yet. [Neutral]
DIVERGENCES & TRENDS
- Bullish divergence: Price made a lower low around $49.4 in early November while RSI (about 34–35) and MACD (-1.4) held far above their October lows. This signals fading downside momentum.
- Bearish divergence: CMF is falling to new lows while price holds up, so the money-flow trend conflicts with the price stabilization.
- Crossovers: The MACD bullish signal-line cross is already in place. The DI lines are converging and could cross soon. The SMA50D crossed below the SMA200D (death cross) around Nov 11–12, a lagging long-term bearish signal.
- Trend: The MAs are stacked bearishly (EMA21 < EMA55 < SMA50D < SMA200D) and price is about 6% below the SMA200D. Price has been range-bound between about $49.4 and $51.6 for roughly six weeks, after a decline from about $65.
- Nov 4 spike: The intraday spike toward $53 reversed sharply to $49.76, which shows supply above $51.6.
CHART PATTERNS
- Bullish Double Bottom / Bullish Triple Bottom-style base: Repeated lows near $49.4–49.6 (Oct 30–Nov 6) with a neckline around $51.6–53 (the Bollinger upper band and the Nov 4 spike high). A close above about $52 would activate a measured move of roughly $2.5–3 (base-to-neckline), giving a target of $53.5–55.
- Narrowing range after a steep decline (a loose Bearish Pennant/Flag): If price breaks below $49.40, the measured move from the consolidation points to roughly $47–47.5.
- The base structure is slightly better supported by momentum indicators (MACD, RSI divergence). The bearish case is supported by CMF and the MA stack.
POTENTIAL SCENARIOS
- Scenario 1: Bullish Base Breakout and Mean Reversion — Price holds the $49.40 double-bottom area, MACD and RSI keep rising, and price reclaims the 21 EMA and the Bollinger upper band, then pushes toward the EMA55 and SMA50D cluster. Trigger: daily close above $51.65 and then $52.50 on rising volume. Target: $53.70–54.10. Invalidation: close below $49.40. (45% probability)
- Scenario 2: Bearish Breakdown Continuation — Distribution (CMF -0.27) wins, price fails again at the 21 EMA and the downtrend resumes after the squeeze. Trigger: daily close below $49.40 with expanding volume and RSI below 40. Target: $47.00–47.50. Invalidation: close above $52.50. (35% probability)
- Scenario 3: Neutral Range Chop — Price continues oscillating inside the $49.4–51.6 range as ADX fades. Trigger: no close outside the range for the next several weeks. Target: $50.00–51.50. Invalidation: a daily close outside $49.40–$52.00. (20% probability)
PRICE TARGETS
Timeframe: 34 days (about Dec 19, 2026).
- Target Price: $52.80
- Expected Range: $48.50 to $56.00 (width $7.50, about 14.7% of current price, consistent with the 30–60 day guidance)
- Key Levels: Support at $49.40, Resistance at $53.69
OVERALL BIAS
OVERALL BIAS: BULLISH - Momentum is turning up (MACD bullish cross, RSI higher lows with bullish divergence, DI convergence) from a six-week base near $49.4, and price is stretched about 6% below the long-term averages, which favors a mean-reversion bounce toward $53–54. Conviction is modest, since CMF distribution, the death cross and the MA stack keep a breakdown below $49.40 a real risk.
This is educational analysis and not financial advice.