BAC 6-day bearish forecast — Nov 1, 2026
- Bias: Bearish
- Timeframe: 6 days (made Nov 1, 2026, target date Nov 6, 2026)
- Price at analysis: $50.01
- Price target: $49.55
- Expected range: $48.85 – $51.35
- Result: Correct (-0.9%) — closed at $49.54 on Nov 6, 2026; quality score 100/100
Get a free AI analysis of BAC today
Analysis
TECHNICAL INDICATORS
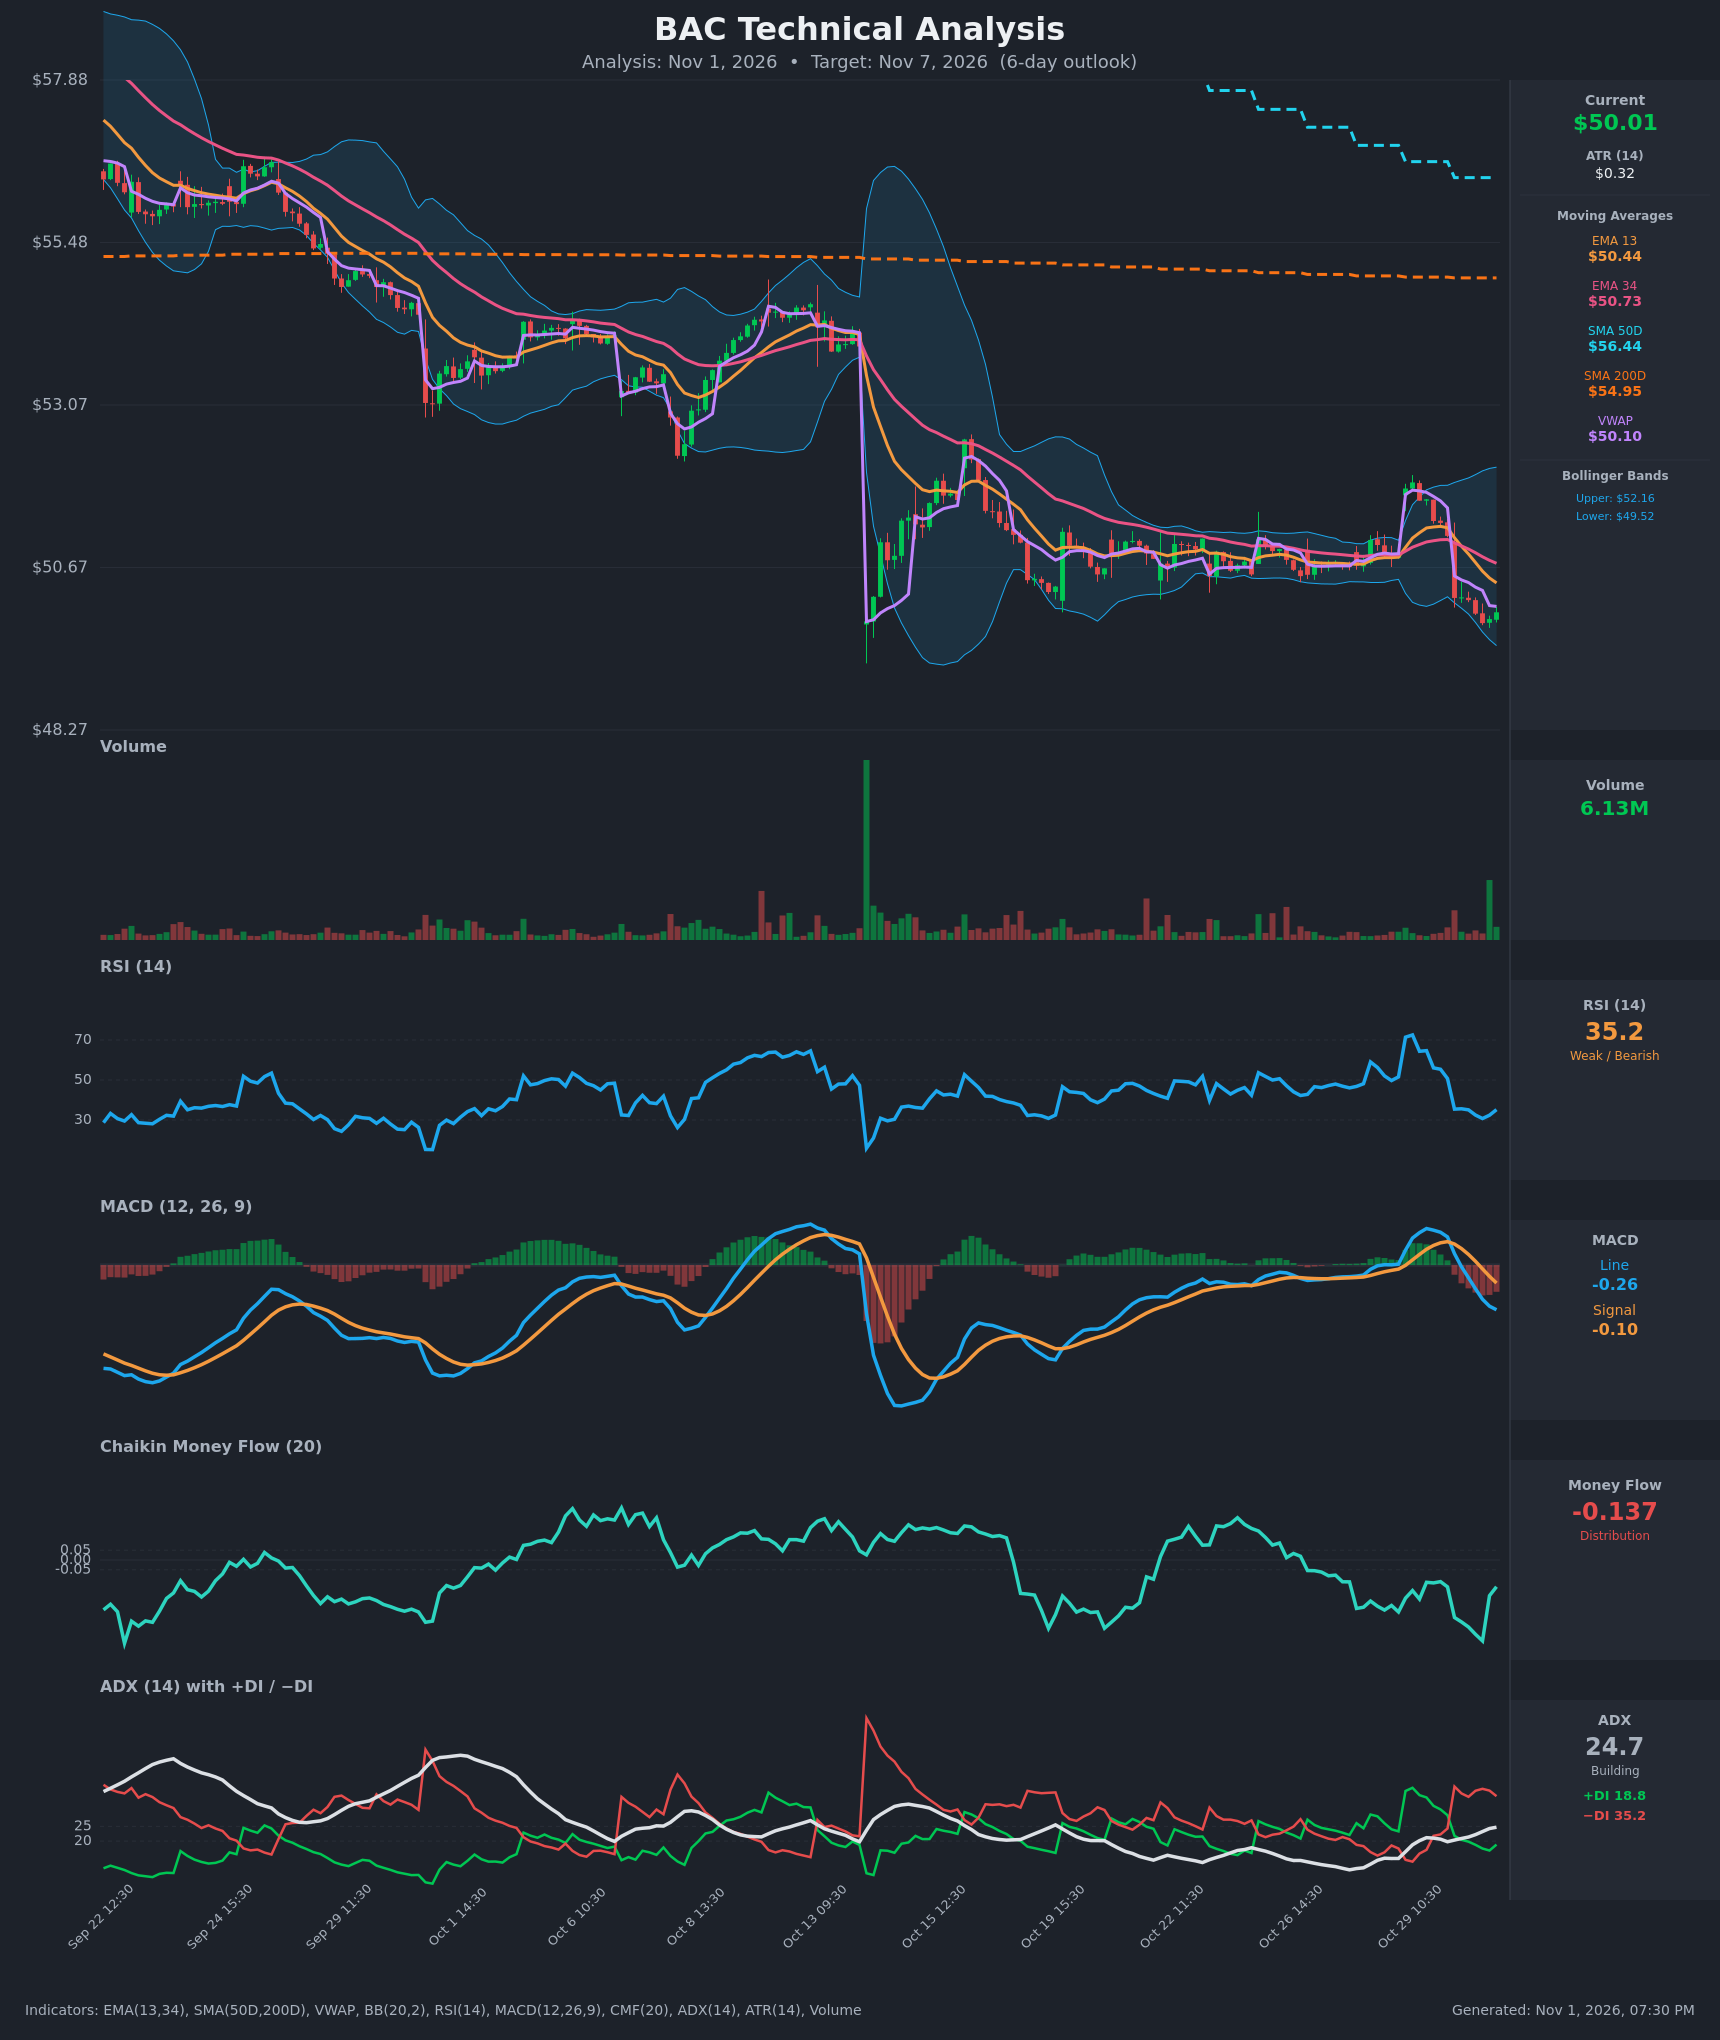
- RSI (14): 35.18, down from the 70+ spike on Oct 29 and near the oversold line. It bottomed at 30.7 and has ticked up to 35. Momentum is weak but already stretched, so a bounce is possible. [Bearish]
- 20 EMA: The chart shows EMA 13 at $50.44 and EMA 34 at $50.73. Price at $50.01 is below both, and EMA13 crossed below EMA34 on Oct 30. Both are now overhead resistance. [Bearish]
- MACD: Line -0.256 is below signal -0.103, with a bearish crossover on Oct 30 and a widening negative histogram. The line is still diving below zero. [Bearish]
- Bollinger Bands (20): Upper $52.16, lower $49.52. Price is in the lower quarter of the bands, about $0.49 above the lower band. The recent walk down the lower half shows sellers in control. A tag of the lower band could trigger a short-term bounce. [Bearish]
- CMF (20): -0.137, well below the -0.05 threshold and mostly negative since mid-October. It briefly deepened to about -0.41 and has recovered only slightly. This points to sustained distribution. [Distribution]
- ADX (14): 24.7 and rising, just under the 25 trend threshold. −DI (35.2) is far above +DI (18.8), so bears control. The trend is on the verge of qualifying as strong. [Strong Trend, Bearish]
- Volume: 6.13M on the latest bar, a green bar and the largest in recent weeks apart from the Oct 13 gap day. It could mark early dip buying or a capitulation attempt, but price has not followed through. The selloff bars on Oct 30 also carried above-average volume. [Mixed, slightly Bearish]
DIVERGENCES & TRENDS
- No clear bullish RSI divergence yet. RSI is making a slightly higher low (30.7 to 35) while price is flat to lower, which is a very early sign of selling exhaustion that needs confirmation.
- Price is below VWAP ($50.10), the 13 and 34 EMAs, the SMA200D ($54.95) and the SMA50D ($56.44). Both long-term averages slope down, with SMA50D falling toward SMA200D. The SMA50D is still above the SMA200D, so there is no death cross yet. One is plausible in coming weeks if weakness persists.
- Bearish crossovers have fired in the EMAs (13 below 34), MACD (line below signal) and DI (−DI above +DI since Oct 30). CMF is negative and ADX is rising, so downside momentum is building.
- The Oct 29 gap up and 71 RSI spike was fully reversed on Oct 30. That looks like a failed rally and a bull trap.
CHART PATTERNS
- Bearish continuation structure: BAC fell from about $57 to $50 in a series of lower highs. After the Oct 13 gap down it consolidated sideways from Oct 15 to Oct 28 in a roughly $50.4–$51.5 range, resembling a Bearish Flag / Rectangle. The Oct 30 breakdown below the base resolves it to the downside.
- Target: The measured move from the range and gap low points to roughly $49.4–$49.6, matching the lower Bollinger Band and the Oct 13 gap-low zone. A deeper break would target about $48.8.
- The failed Oct 29 spike also shapes up as a rejection at the top of the range, consistent with the bearish read.
POTENTIAL SCENARIOS
- Scenario 1: Bearish Grind to Band/Gap-Low Support — Price stays below the falling 13/34 EMAs and VWAP, and sellers push it to the lower Bollinger Band and the Oct 13 gap-low area. Trigger: failure to reclaim $50.44 (EMA13) and a move below $49.85. Target: $49.40–$49.60. Invalidation: a daily close above $50.75 (EMA34). (45% probability)
- Scenario 2: Bearish Breakdown Extension — A break below the $49.52 band and gap low accelerates the selling, with ADX moving above 25 on −DI dominance. Trigger: a close below $49.40 on rising volume. Target: $48.70–$48.90. Invalidation: a reclaim of $50.00 after the break. (20% probability)
- Scenario 3: Bullish Oversold Relief Bounce — RSI near 30 and the last bar's volume surge spark a mean-reversion bounce into the EMA cluster. Trigger: a hold above $49.85 and a push through $50.44. Target: $50.70–$51.20. Invalidation: rejection at EMA34 and a drop back below $49.85. (35% probability)
PRICE TARGETS
Timeframe: 6 days, so the range width should be ~4-8% of price. The range below is $2.50, which is 5.0% of $50.01.
- Target Price: $49.55 (6 days from now)
- Expected Range: $48.85 to $51.35
- Key Levels: Support at $49.52, Resistance at $50.73
OVERALL BIAS
OVERALL BIAS: BEARISH - Price is below all key moving averages and VWAP, with a bearish MACD crossover, −DI far above +DI with ADX rising, and persistent negative CMF. The failed Oct 29 rally and the break of the multi-day range point to a measured move toward $49.5, though an oversold RSI makes a relief bounce a real risk.
This is educational analysis and not financial advice.