XLE 4-day bullish forecast — Nov 1, 2026
- Bias: Bullish
- Timeframe: 4 days (made Nov 1, 2026, target date Nov 4, 2026)
- Price at analysis: $70.00
- Price target: $70.45
- Expected range: $68.90 – $71.40
- Result: Incorrect (-9.2%) — closed at $63.56 on Nov 4, 2026; quality score 0/100
Get a free AI analysis of XLE today
Analysis
TECHNICAL INDICATORS
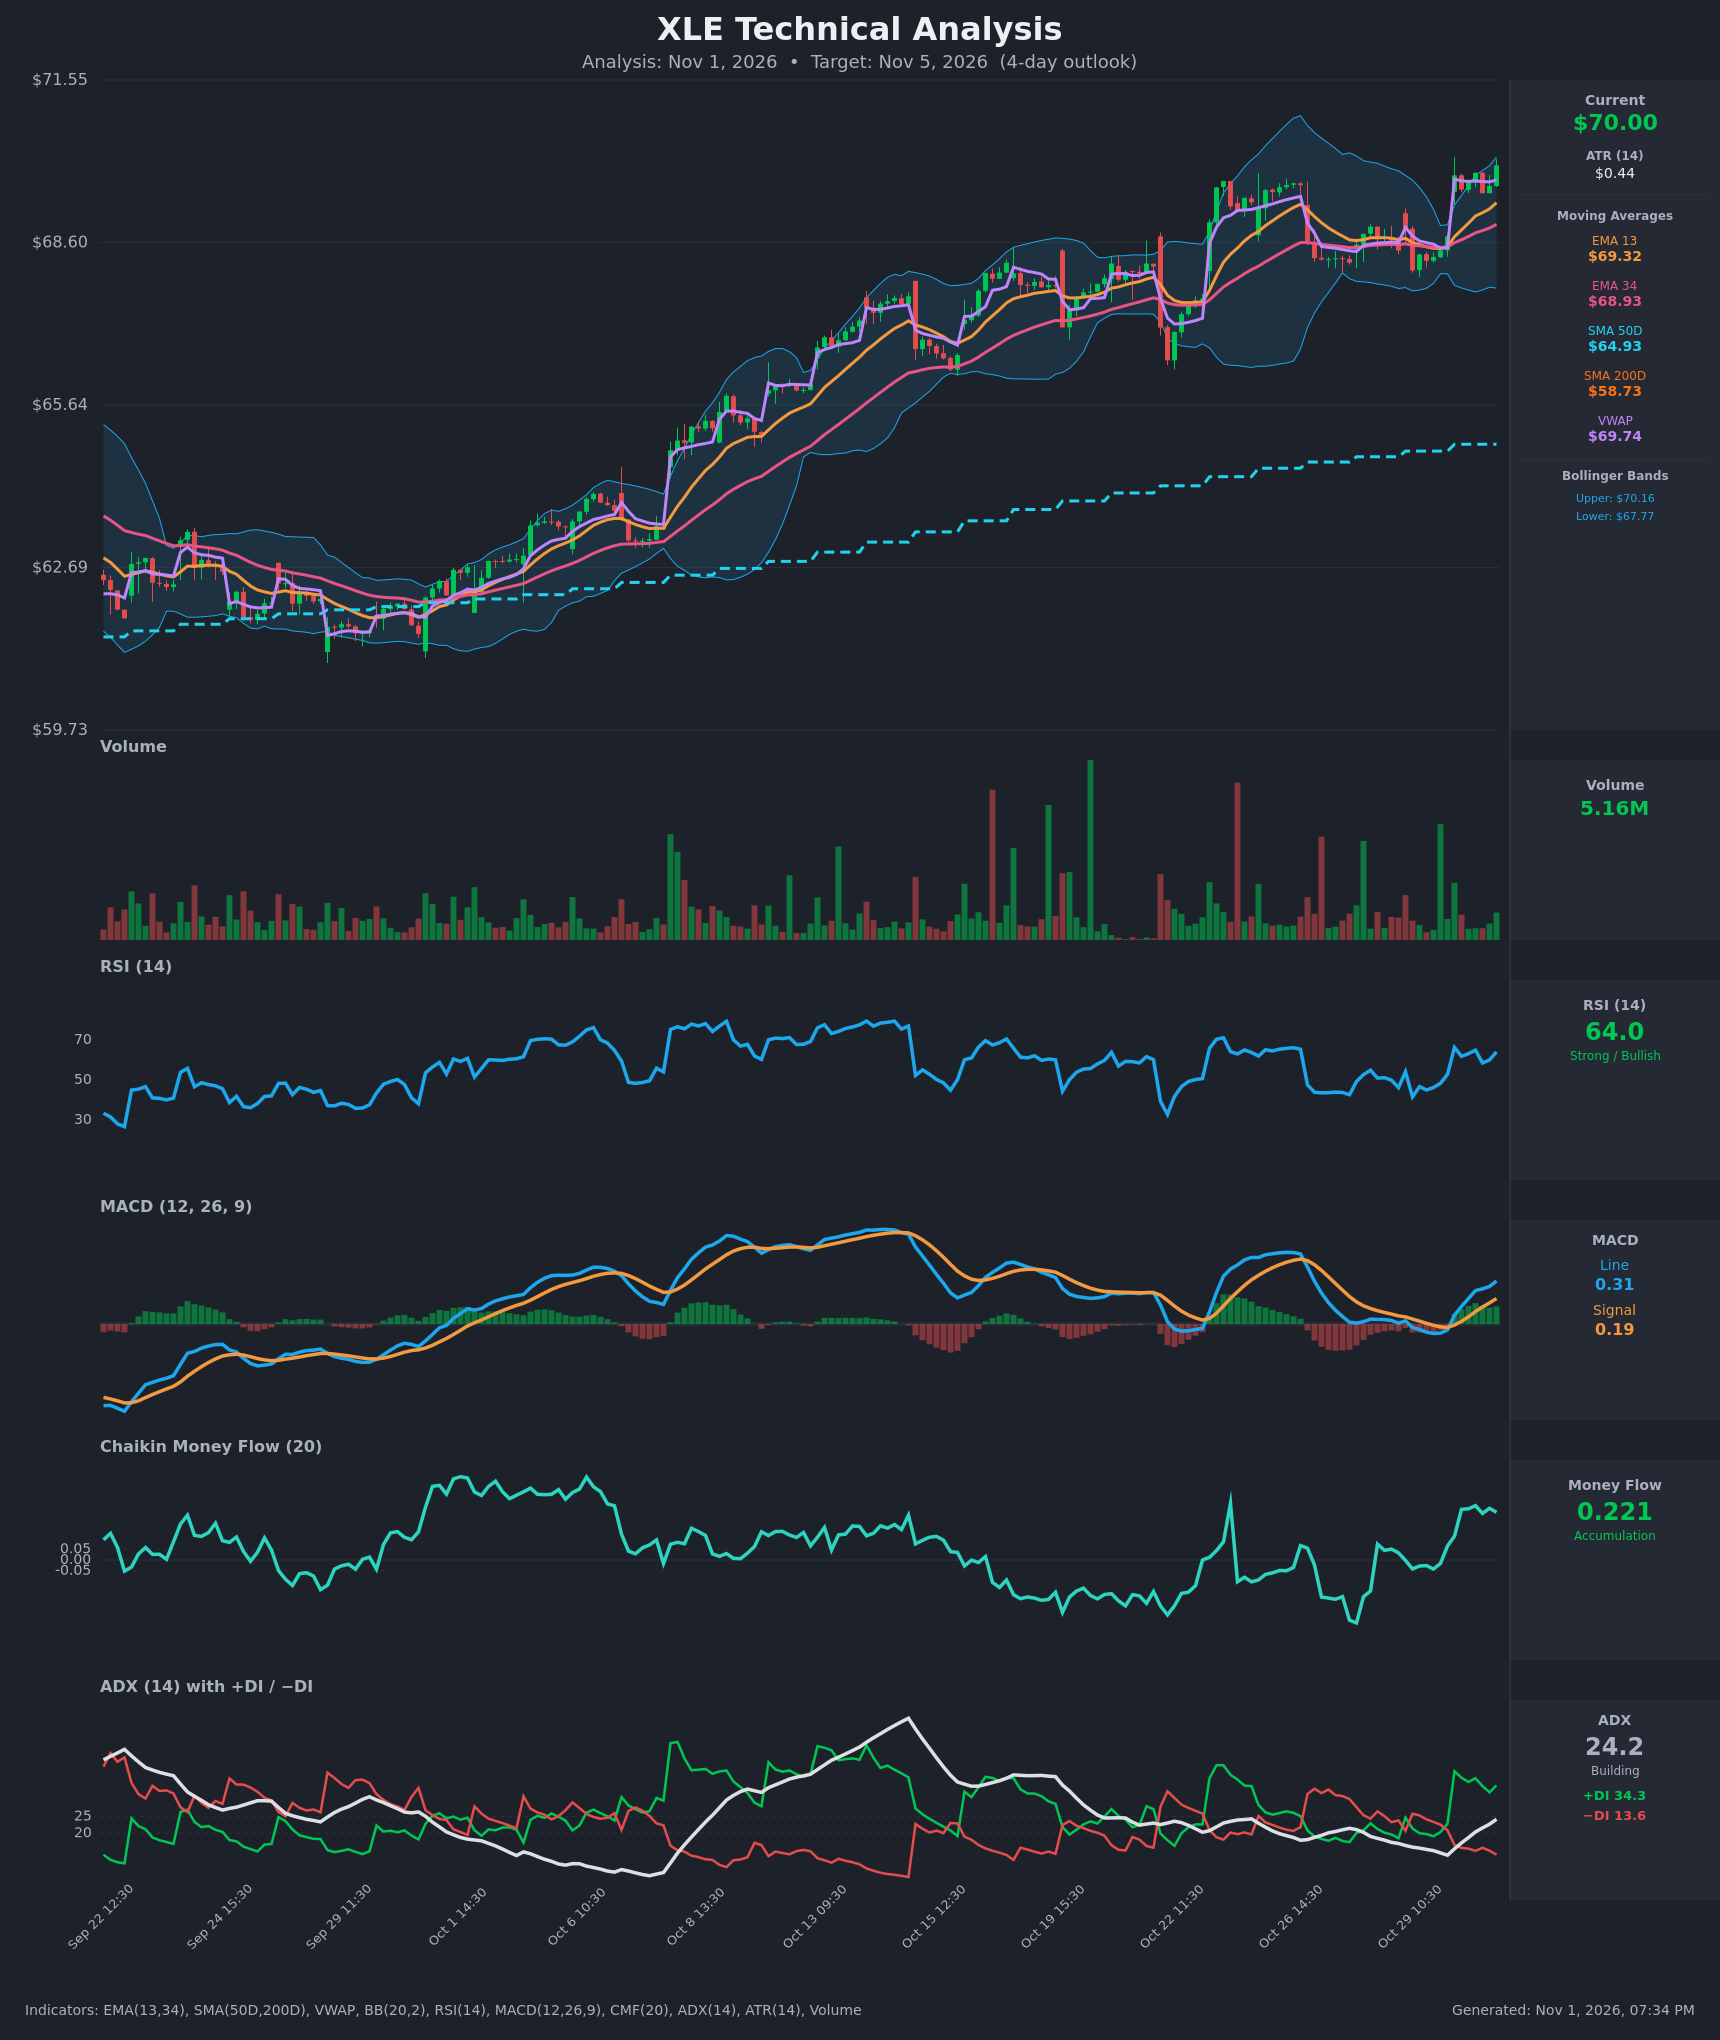
- RSI (14): 64.04, up from the mid-40s on Oct 29 and a 66.3 peak on Oct 30. It is firmly bullish but still below the 70 overbought line, so there is room to run. [Bullish]
- 20 EMA (EMA 13 / EMA 34 used): EMA 13 is $69.32 and EMA 34 is $68.93, with EMA 13 above EMA 34 and both rising. Price at $70.00 is above both, so they act as dynamic support at about $69.3 and $68.9. [Bullish]
- MACD: The line is 0.313 and the signal is 0.186. The line crossed above the signal on Oct 30 (the bar at 09:30) and the histogram is positive and expanding at about +0.13. [Bullish]
- Bollinger Bands (20): Upper is $70.16 and lower is $67.77, with the midline near $68.96. Price at $70.00 sits at the upper band (about 94% of the band width) after a squeeze followed by an upside breakout. This is strong, though short-term stretched, and a band walk is possible. [Bullish]
- CMF (20): 0.221, well above +0.05 and rising from slightly negative readings on Oct 29. This shows clear accumulation and supports the breakout. [Accumulation]
- ADX (14): 24.2 and rising from about 13, close to the 25 trend threshold. +DI is 34.3 against −DI at 13.6, so bulls are firmly in control and the trend is emerging. [Strong Trend building, Bullish]
- Volume: 5.16M, modest compared with the spikes earlier in the move. The Oct 30 gap-up bar carried decent green volume, but the last few bars are lighter, so confirmation is only moderate. [Neutral-to-mildly Bullish]
DIVERGENCES & TRENDS
- No bearish RSI or MACD divergence is visible. RSI (64) is below its prior peak of about 75 in mid-October while price is at a new high, a mild momentum lag but not a true divergence given the different regime.
- Price is far above SMA50D ($64.93) and SMA200D ($58.73), and SMA50D is well above SMA200D. The golden cross is long established and the long-term trend is up.
- Price gapped from about $68.7 to $69.8 on Oct 30 and has since held above VWAP ($69.74), which confirms buyers are in control.
- MACD crossed bullish, +DI is far above −DI, and ADX is rising. CMF has turned sharply positive after a long negative stretch (Oct 15-28), so the accumulation shift is recent and constructive.
- The risk is a short-term stretch: price is at the upper Bollinger Band and about $1.07 above the 13 EMA/34 EMA midpoint zone, so a pause or pullback toward $69.3 is plausible.
CHART PATTERNS
- Bullish breakout from consolidation: Price built a base in the $68.0-$69.0 range from Oct 26-29 (similar to a bullish flag or pennant on the reference diagram) and broke out upward on Oct 30. The measured move points to roughly $70.7-$71.5.
- Higher highs and higher lows: The staircase advance since early October is intact.
- Resistance: The $70.15-$70.20 area (upper Bollinger Band) and the prior high near $70.3-$70.5 are the immediate hurdles. No bearish reversal pattern such as a double top or head and shoulders is evident.
POTENTIAL SCENARIOS
- Scenario 1: Bullish Breakout Continuation — Price holds above the VWAP and 13 EMA and pushes through the upper band as ADX crosses 25 with accumulation continuing. Trigger: a close above $70.20 with volume. Target: $70.80-$71.20. Invalidation: close below $69.30 (EMA 13/VWAP). (55% probability)
- Scenario 2: Neutral Consolidation Near the Highs — Price digests the gap and the stretched RSI by chopping between the EMA 13 and the upper band. Trigger: failure to clear $70.20 on volume. Target: $69.40-$70.20 range. Invalidation: a decisive break either side of $69.30 or $70.40. (28% probability)
- Scenario 3: Bearish Pullback — A rejection at the upper band fills the gap back toward the EMA 34. Trigger: close below $69.30 with MACD histogram fading. Target: $68.60-$68.95. Invalidation: reclaim of $70.00 and VWAP. (17% probability)
PRICE TARGETS
- Target Price: $70.45 (4-day horizon)
- Expected Range: $68.90 to $71.40 (width $2.50, about 3.6% of price, in line with the 2-4% guidance for short timeframes)
- Key Levels: Support at $69.32, Resistance at $70.60
OVERALL BIAS
OVERALL BIAS: BULLISH - The MACD bullish crossover, +DI dominance with rising ADX, strong CMF accumulation, and price above all moving averages and VWAP after a breakout from consolidation outweigh the short-term stretch at the upper Bollinger Band. A brief pullback toward $69.30 is possible but the trend favors higher prices.
This is educational analysis and not financial advice.