XLE 62-day bullish forecast — Nov 15, 2026
- Bias: Bullish
- Timeframe: 62 days (made Nov 15, 2026, target date Jan 15, 2027)
- Price at analysis: $64.96
- Price target: $67.00
- Expected range: $59.50 – $71.00
- Result: Pending — graded after the close on Jan 15, 2027
Get a free AI analysis of XLE today
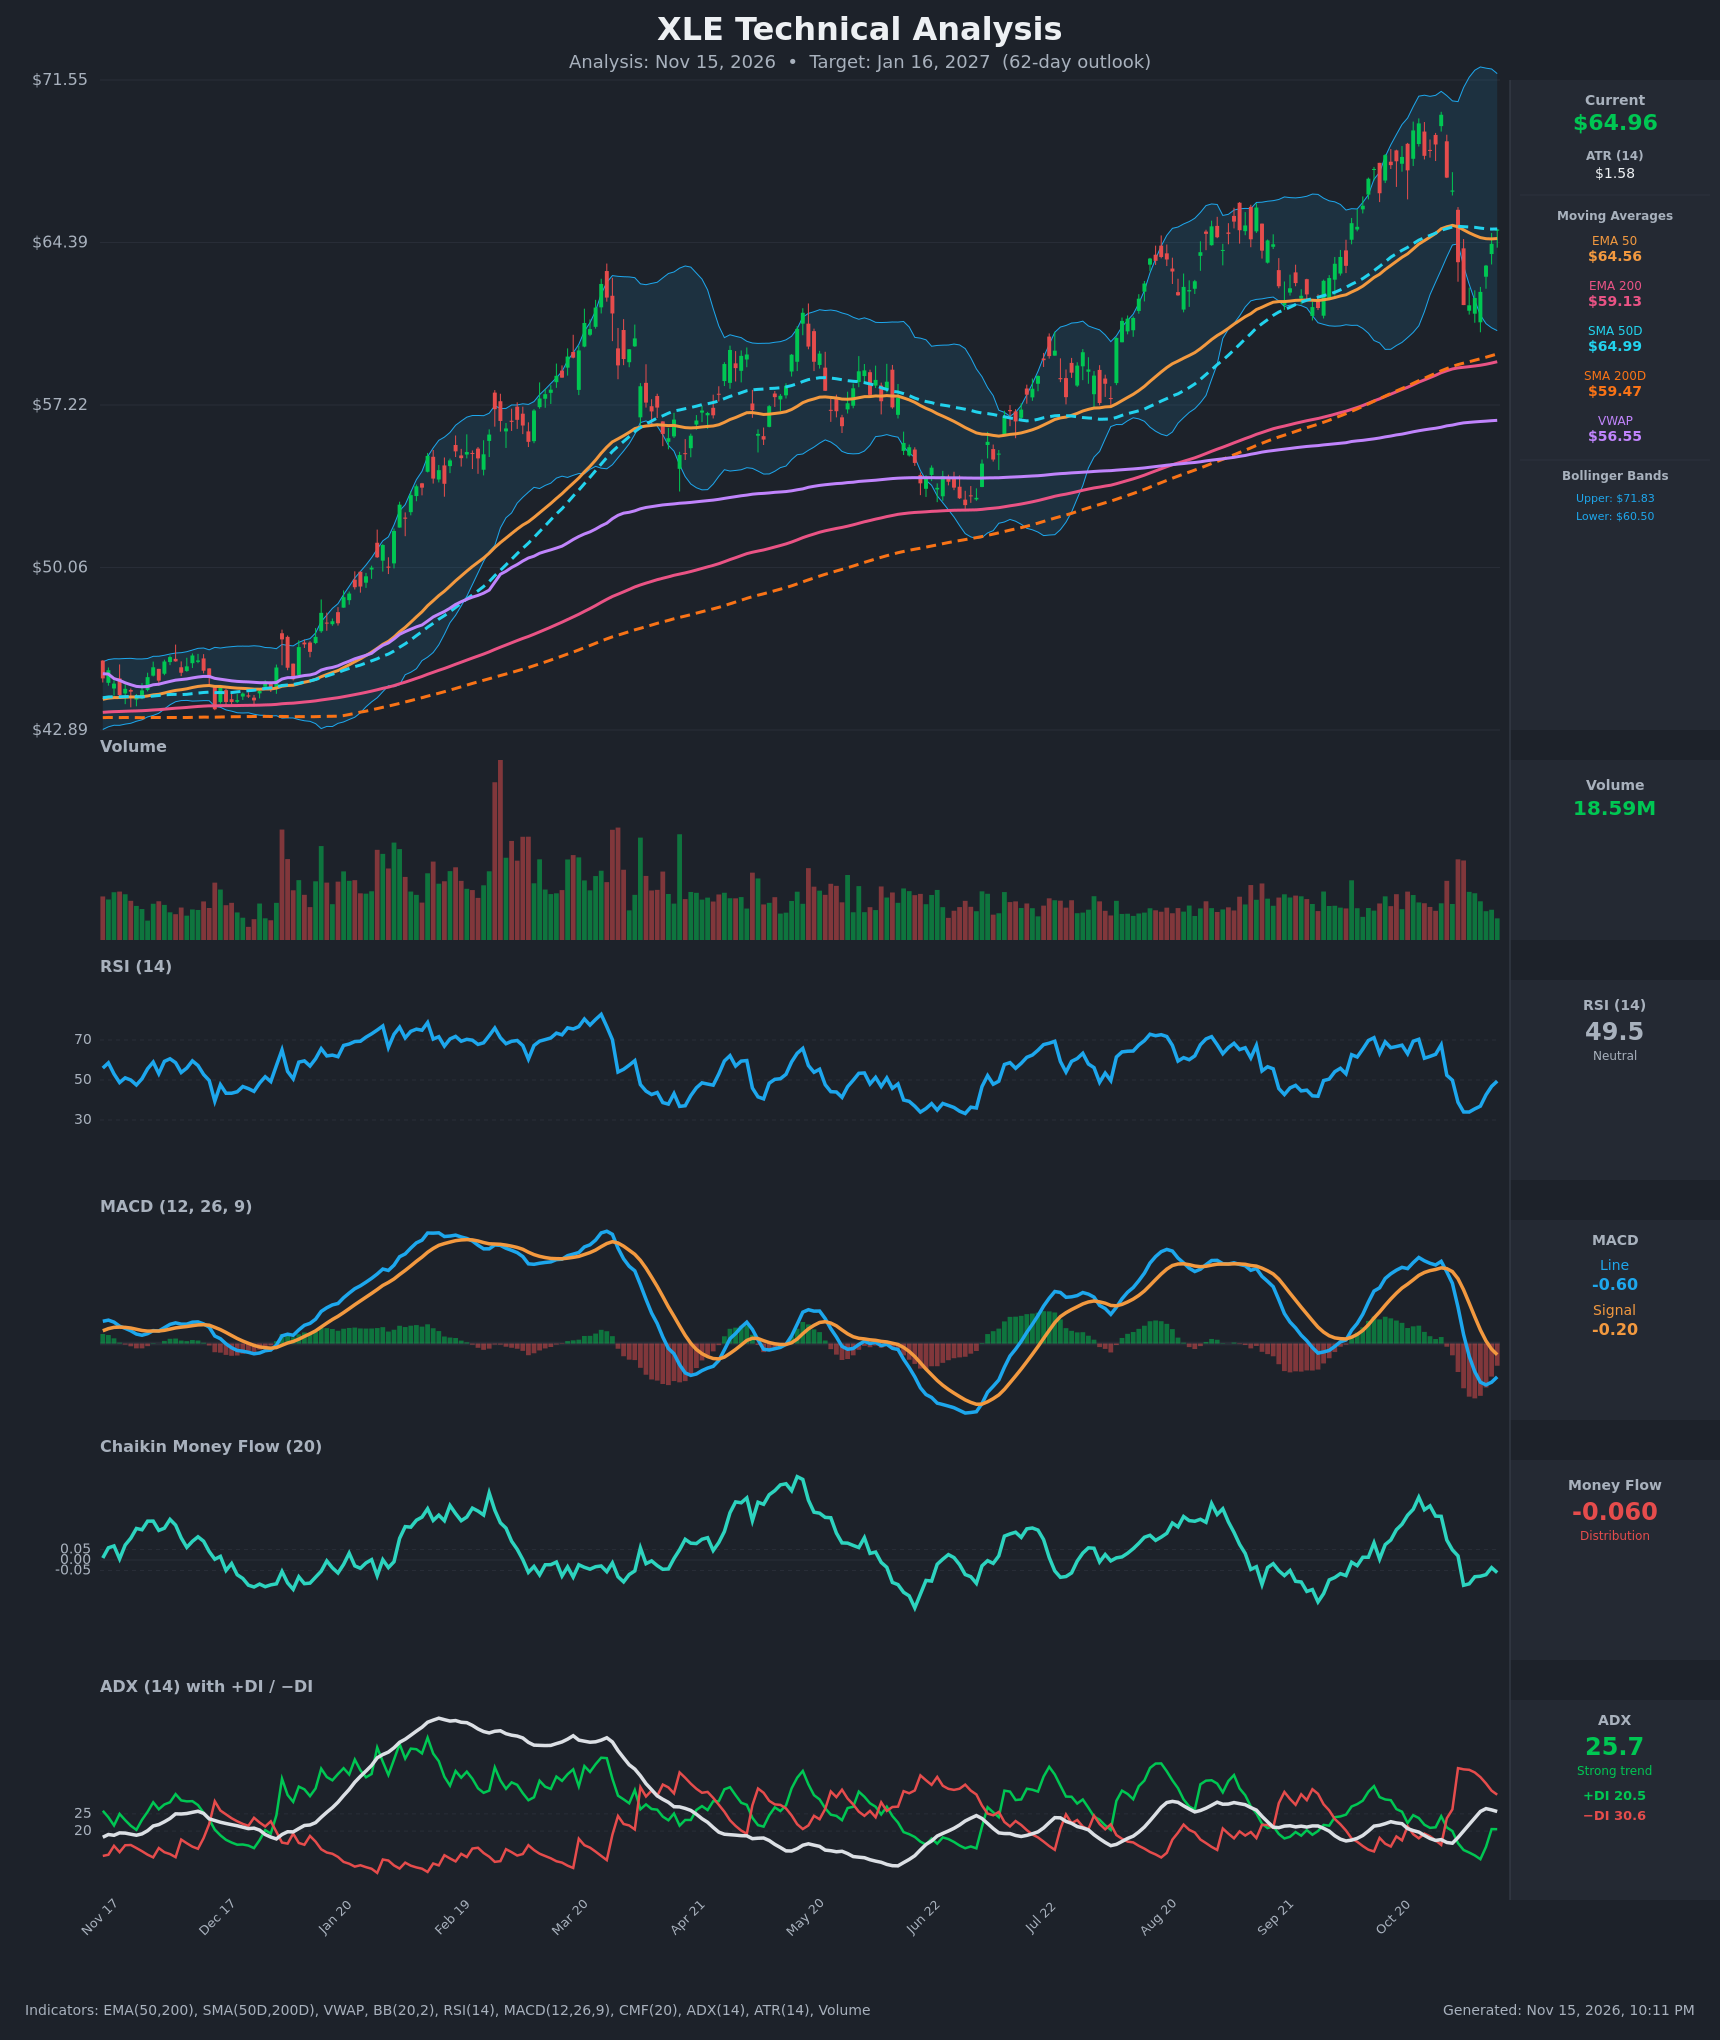
Analysis
TECHNICAL INDICATORS
- RSI (14): 49.45, up from a 34 trough on Nov 5-6 and now back at the 50 midline. Momentum has recovered from near-oversold but hasn't yet pushed into bullish territory (>55). [Neutral]
- 20 EMA: Not supplied. The chart shows the BB midline (20-period) at roughly $66.2, above price, which acts as near-term resistance. Price sits right on EMA50 ($64.56) and SMA50D ($64.99), a pivot zone. [Neutral]
- MACD: Line -0.597 is below signal -0.200, so the histogram is negative (about -0.40). The line has turned up from -0.740 while the signal is still falling, so the gap is narrowing and a bullish crossover could develop within a couple of weeks. [Bearish, improving]
- Bollinger Bands (20): Upper $71.83, lower $60.50, midline about $66.2. Price rebounded from the lower band zone (about $61.6) and is in the lower half of the bands. The bands are wide after the October swing, so volatility is elevated. A reclaim of the midline would confirm the rebound. [Neutral]
- CMF (20): -0.060, just below the -0.05 threshold. It has fallen from +0.30 in late October to slightly negative, and it has not turned up during the rebound. This suggests mild distribution and that the bounce lacks conviction. [Distribution]
- ADX (14): 25.7 with -DI 30.6 above +DI 20.5, so bears are still in control of the short-term trend. ADX has risen from 16.5 to 25.7 on the selloff and is now rolling over (26.5 → 25.7). -DI is falling and +DI is rising, so the bearish trend is weakening. [Strong Trend, bearish but fading]
- Volume: 18.59M, with a spike during the early-November selloff and lighter volume on the rebound. The bounce has less participation than the decline. [Mildly bearish / unconfirmed]
DIVERGENCES & TRENDS
- Long-term trend: Price is above both SMA200D ($59.47) and EMA200 ($59.13), and both are rising. EMA50 ($64.56) is well above EMA200 and SMA50D ($64.99) is well above SMA200D, so there is no death cross and the structure is a bullish uptrend.
- Short-term trend: The Oct 26-30 push to about $70 failed. Price dropped to $61.6 (about -12%) in a week, with a MACD bearish crossover on Nov 6 and a -DI crossover on Nov 2.
- Recovery: RSI and MACD are both turning up, but CMF has not confirmed, and volume is light.
- Price vs. MAs: Price is sitting on the 50-day averages (EMA50 $64.56 / SMA50D $64.99). The EMA50 has flattened and the SMA50D has started to roll over slightly. A close above $65 that holds would be constructive; rejection here would reopen $61.6.
- VWAP: Price is well above VWAP ($56.55), a sign of longer-term buyer control.
- Divergence: No clear RSI/price divergence. The Oct highs and the earlier Aug-Sep highs coincided with RSI near 70, which is consistent with healthy trend momentum.
CHART PATTERNS
- Possible Bearish Double Top: Peaks at about $69.6 (Oct 26) and $70.0 (Oct 30) with a neckline near $61.6. The neckline has not been broken, so the pattern is only a risk. A break below $61.6 would imply a target of about $53 (peak-to-neckline height of about $8.4), roughly the Aug-Sep range and the SMA200D region.
- Bullish continuation context: The larger structure is a series of higher highs and higher lows, with $59-60 (200-day MAs) as underlying support. The pullback to $61.6 held above them. The current rebound could be a retest of the 50-day MA zone before a continuation higher, with a measured retest of about $70.
- Takeaway: Price is in a range of about $61.6 to $70 with the 50-day MAs in the middle. The pattern is unresolved, but the dominant long-term trend favors the upside.
POTENTIAL SCENARIOS
- Scenario 1: Bullish Trend Resumption — The rebound holds the 50-day MAs, MACD crosses back above signal, and +DI crosses above -DI as price recovers the BB midline and retests the October highs. Trigger: daily close above about $66.2 (BB midline) with MACD bullish cross and CMF back above +0.05. Target: $67-$70, with an extension toward $71.8 (upper band). Invalidation: close below $61.6. (45% probability)
- Scenario 2: Bearish Double-Top Breakdown — The rebound stalls at the 50-day MAs, CMF stays in distribution, and -DI remains dominant, leading to a break of the $61.6 neckline. Trigger: rejection at $65-$66 and a close below $61.6. Target: $58-$60 (200-day MAs), with a possible extension to $53-$55. Invalidation: close above $66.5. (35% probability)
- Scenario 3: Neutral Range Consolidation — Price chops between the 200-day MAs/$61.6 lows and the $66-$70 highs, with ADX falling back below 20. Trigger: failure to break either $61.6 or $67. Target: $63-$67. Invalidation: close outside $60.5-$70. (20% probability)
PRICE TARGETS
- Target Price: $67.00 (62-day, Jan 16, 2027)
- Expected Range: $59.50 to $71.00 (width $11.50, about 17.7% of current price, consistent with the 30-60+ day guidance of ~12-18% scaled to 62 days)
- Key Levels: Support at $61.60, Resistance at $70.00
OVERALL BIAS
OVERALL BIAS: BULLISH - The long-term uptrend is intact, with price above rising 200-day averages and holding the 50-day MA zone. RSI and MACD are recovering and -DI is fading. Conviction is modest because CMF shows distribution, -DI is still on top, and a possible double top could break the $61.6 neckline.
This is educational analysis and not financial advice.