XLE 83-day bullish forecast — Nov 15, 2026
- Bias: Bullish
- Timeframe: 83 days (made Nov 15, 2026, target date Feb 5, 2027)
- Price at analysis: $64.96
- Price target: $67.00
- Expected range: $58.00 – $71.00
- Result: Pending — graded after the close on Feb 5, 2027
Get a free AI analysis of XLE today
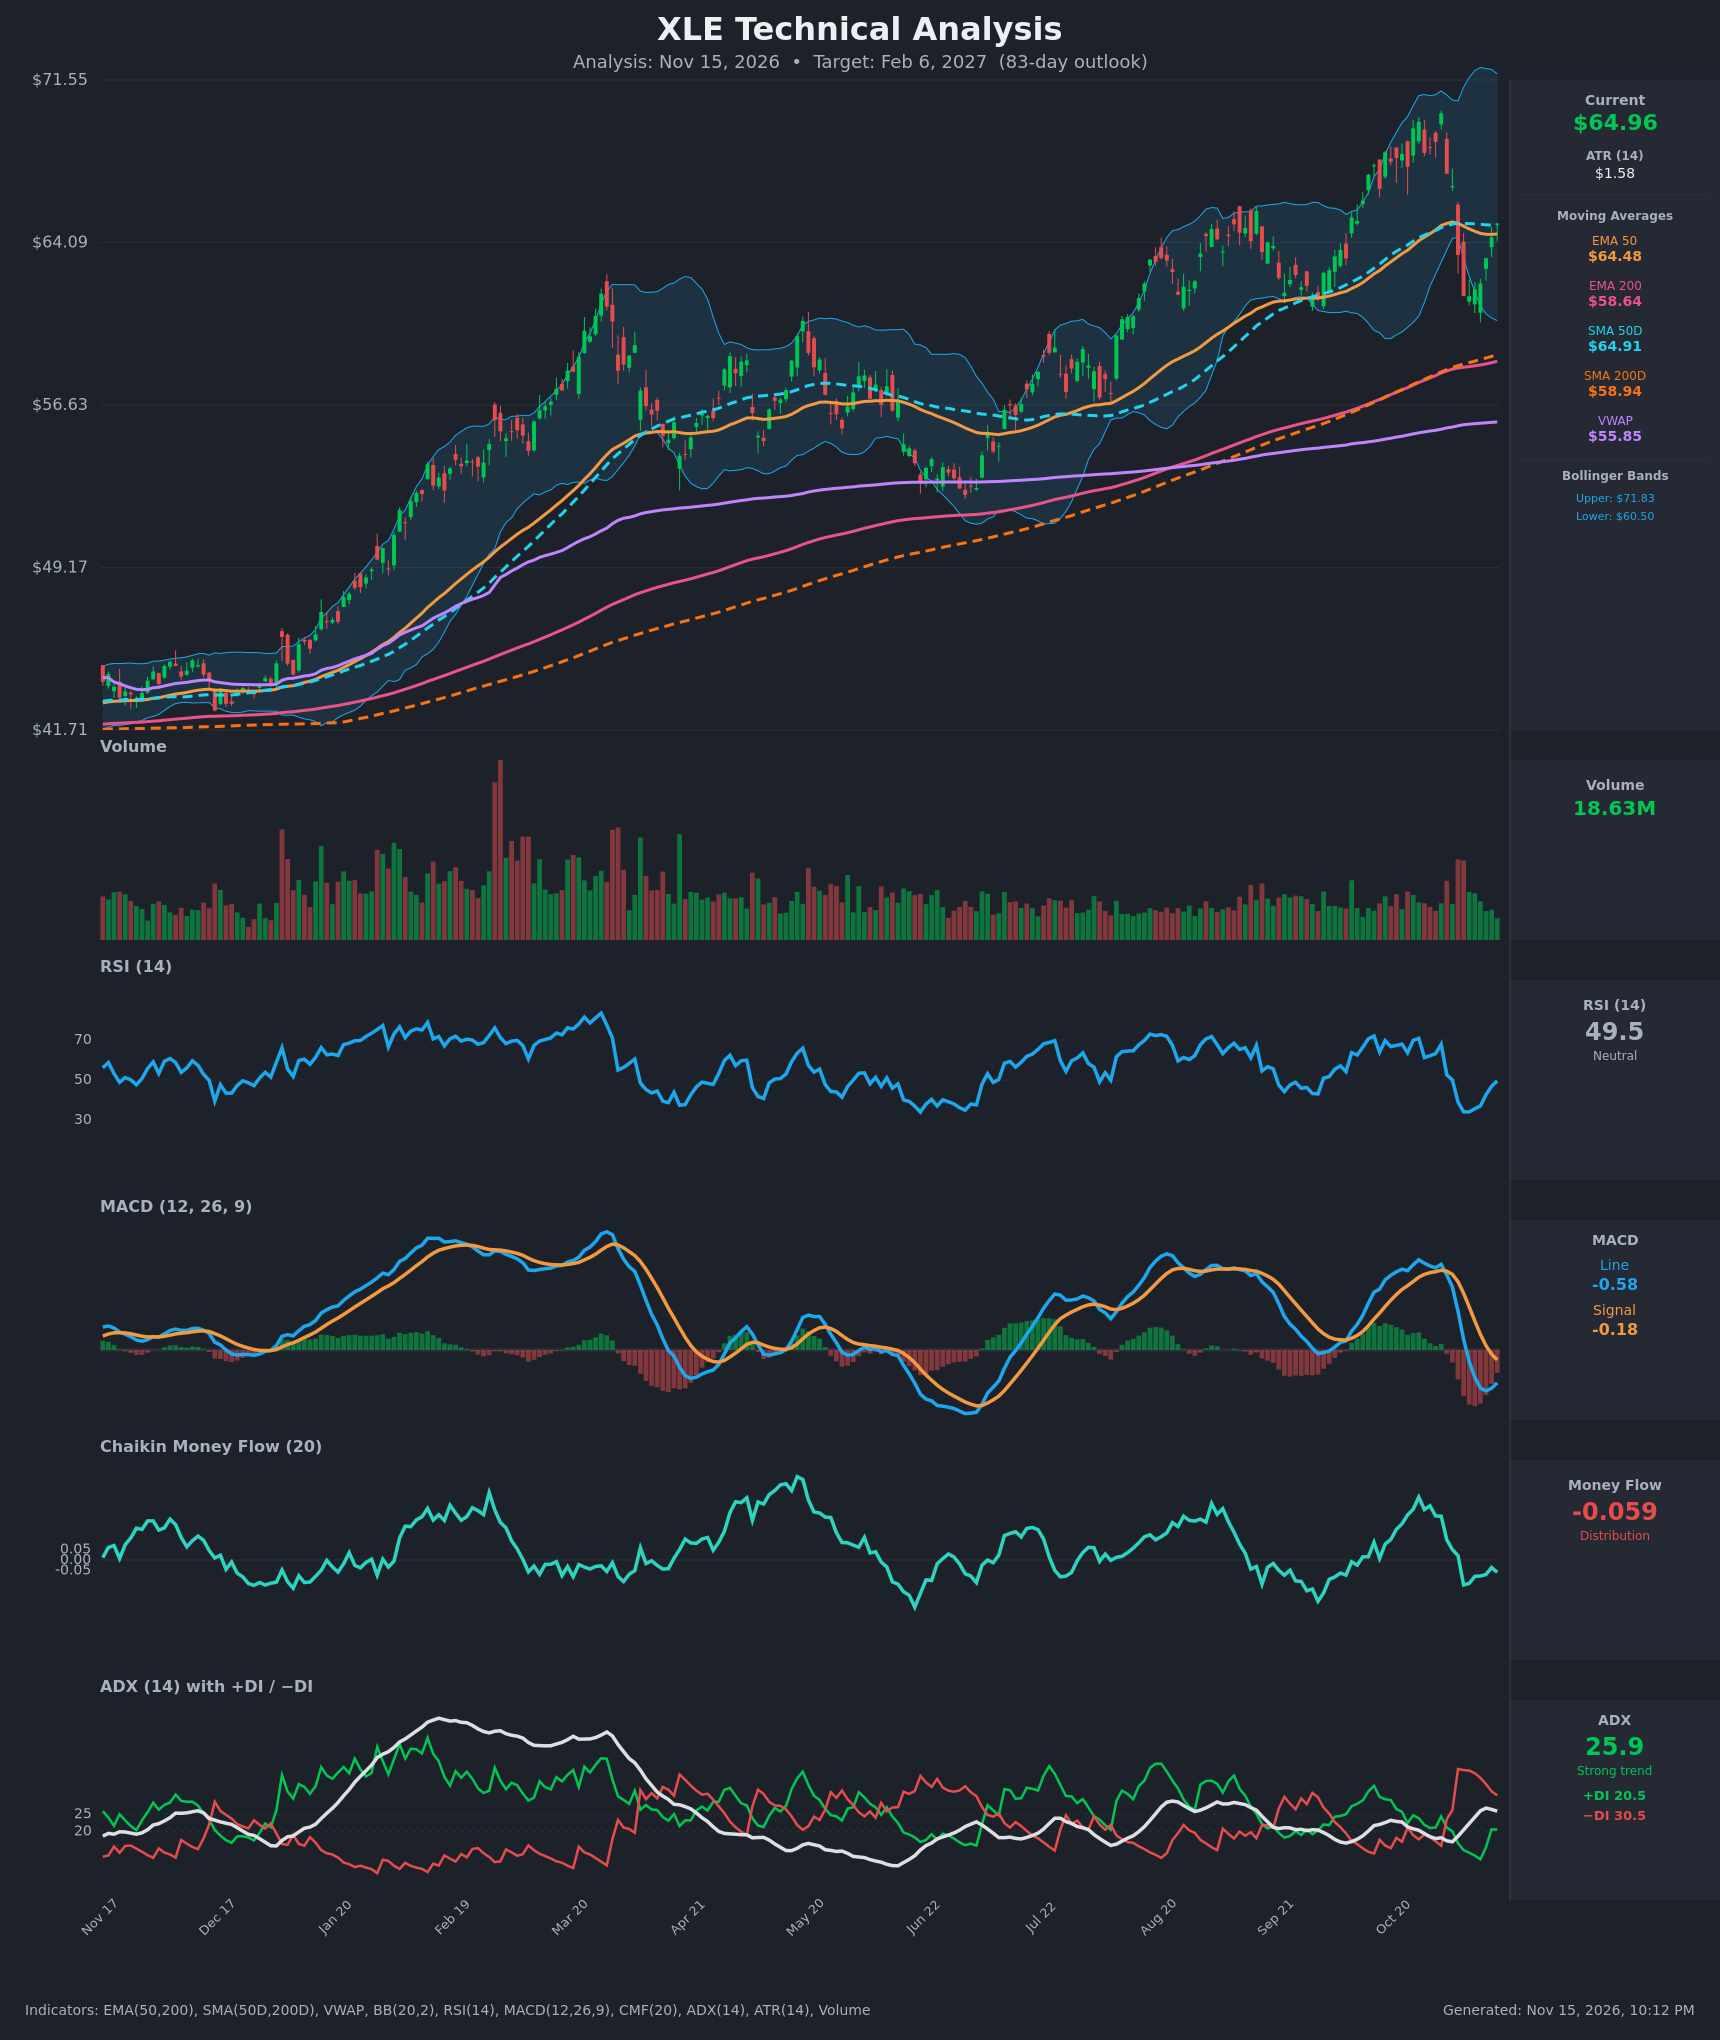
Analysis
TECHNICAL INDICATORS
- RSI (14): 49.53, back at the midline after bottoming near 34 on Nov 5-6. Momentum is rising (34 → 37 → 43 → 47 → 49.5), but it has not yet pushed into bullish territory above 55-60. [Neutral]
- 20 EMA: The chart has no 20 EMA, so I use the EMA 50 ($64.48) and SMA 50D ($64.91). Price at $64.96 is just above both after reclaiming them from below. They are flat and acting as a pivot, and price is only marginally above. EMA 200 ($58.64) and SMA 200D ($58.94) sit well below and are still rising. [Neutral]
- MACD: Line -0.58, signal -0.18, histogram about -0.40. The bearish crossover happened around Nov 6 and the line is now below zero. The histogram has narrowed from about -0.95 on Nov 10, so downside momentum is fading but the signal is still bearish. [Bearish]
- Bollinger Bands (20): Upper $71.83, lower $60.50, mid-band near $66.2. Price bounced off the lower band (about $61.6) and sits just below the midline. The bands are wide after the October spike and the selloff, so volatility is elevated. A move back to the midline is plausible. [Neutral]
- CMF (20): -0.059, just under the -0.05 threshold. It fell from +0.30 in late October to roughly -0.12, and is now only marginally in distribution and improving slightly. [Distribution]
- ADX (14): 25.9 with −DI (30.5) above +DI (20.5), so the short-term trend is down. ADX has slipped from 26.8 and the DI spread is narrowing (+DI up from 11.9, −DI down from 38). The bearish trend is losing strength. [Strong Trend, Bearish, but fading]
- Volume: 18.63M, about average to slightly below the heavy volume of the Nov 4-5 selloff. The rebound is on lighter volume, which gives it only modest conviction. [Neutral]
DIVERGENCES & TRENDS
- Long-term trend: Price is above a rising EMA 200 and SMA 200D (about $58.6-58.9), and EMA 50 stays above EMA 200. The golden cross is long established, and VWAP ($55.85) is far below price. The higher-timeframe uptrend is intact.
- Short-term trend: The October high near $70 to the Nov 5 low near $61.6 was a roughly 12% drop. Price has since retraced about 40% of that drop.
- Momentum: RSI has risen from 34 to 49.5 while MACD is still falling, a mild early sign that momentum is improving.
- Crossovers: The MACD bearish crossover (Nov 6) and the −DI over +DI crossover (Nov 2) are bearish. The recent reclaim of the 50-day averages is bullish. There is no death cross, and the SMA 50D / SMA 200D gap is wide.
- Divergence: There is no clear price/indicator divergence. The RSI and MACD highs in October were consistent with the price high.
CHART PATTERNS
- No clean pattern from the reference diagram. The structure is a pullback within a larger uptrend (a bullish continuation setup). It resembles a failed Bullish Flag or a Symmetrical Triangle forming between $61.6 and $70, but neither is confirmed.
- Range structure: The Oct high near $70 and the Nov low near $61.6 define a $8.4 band. A break above $70 would target about $75-78 (a measured move). A break below $61.6 would target the 200-day averages near $58.6-58.9.
- Rising wedge risk: The 2026 advance contains multiple pullbacks that held the 50-day averages, so a rising-wedge breakdown is possible only if $61.6 fails.
POTENTIAL SCENARIOS
- Scenario 1: Bullish Trend Resumption — Price holds the 50-day averages ($64.5-64.9), MACD turns back up, and XLE retests the upper half of the Bollinger range. Trigger: close above $66.20 (BB midline) with RSI above 55 and a MACD bullish cross. Target: $67-70, with extension toward $72 if $70 breaks. Invalidation: close below $61.60. (45% probability)
- Scenario 2: Bearish Deeper Pullback — Distribution continues, −DI stays dominant, and price rolls over from the 50-day averages to test the rising 200-day averages. Trigger: close below $62.0, then $61.6, with CMF below -0.10. Target: $58.6-59.0 (EMA/SMA 200). Invalidation: close above $66.5. (35% probability)
- Scenario 3: Neutral Consolidation — Price chops between $61.6 and $68 as ADX drops below 20 and the averages converge. Trigger: repeated failures at both $68 and $62. Target: $63-66. Invalidation: close outside the $61.6-70 range. (20% probability)
PRICE TARGETS
- Target Price: $67.00 (83-day horizon, to Feb 6, 2027)
- Expected Range: $58.00 to $71.00 (width $13.00, about 20% of current price, in line with the 61-180 day guidance)
- Key Levels: Support at $61.60, Resistance at $70.02
OVERALL BIAS
OVERALL BIAS: BULLISH - Price has reclaimed the 50-day averages and sits well above the rising 200-day averages, so the dominant uptrend is intact. Short-term momentum (negative MACD, −DI above +DI, slightly negative CMF) is bearish but fading, with RSI recovering. Over 83 days the trend and mean reversion toward the BB midline and prior highs outweigh the short-term weakness, though conviction is moderate.
This is educational analysis and not financial advice.