XLE 48-day bullish forecast — Nov 15, 2026
- Bias: Bullish
- Timeframe: 48 days (made Nov 15, 2026, target date Jan 1, 2027)
- Price at analysis: $64.96
- Price target: $66.80
- Expected range: $60.20 – $70.00
- Result: Pending — graded after the close on Jan 1, 2027
Get a free AI analysis of XLE today
Analysis
TECHNICAL INDICATORS
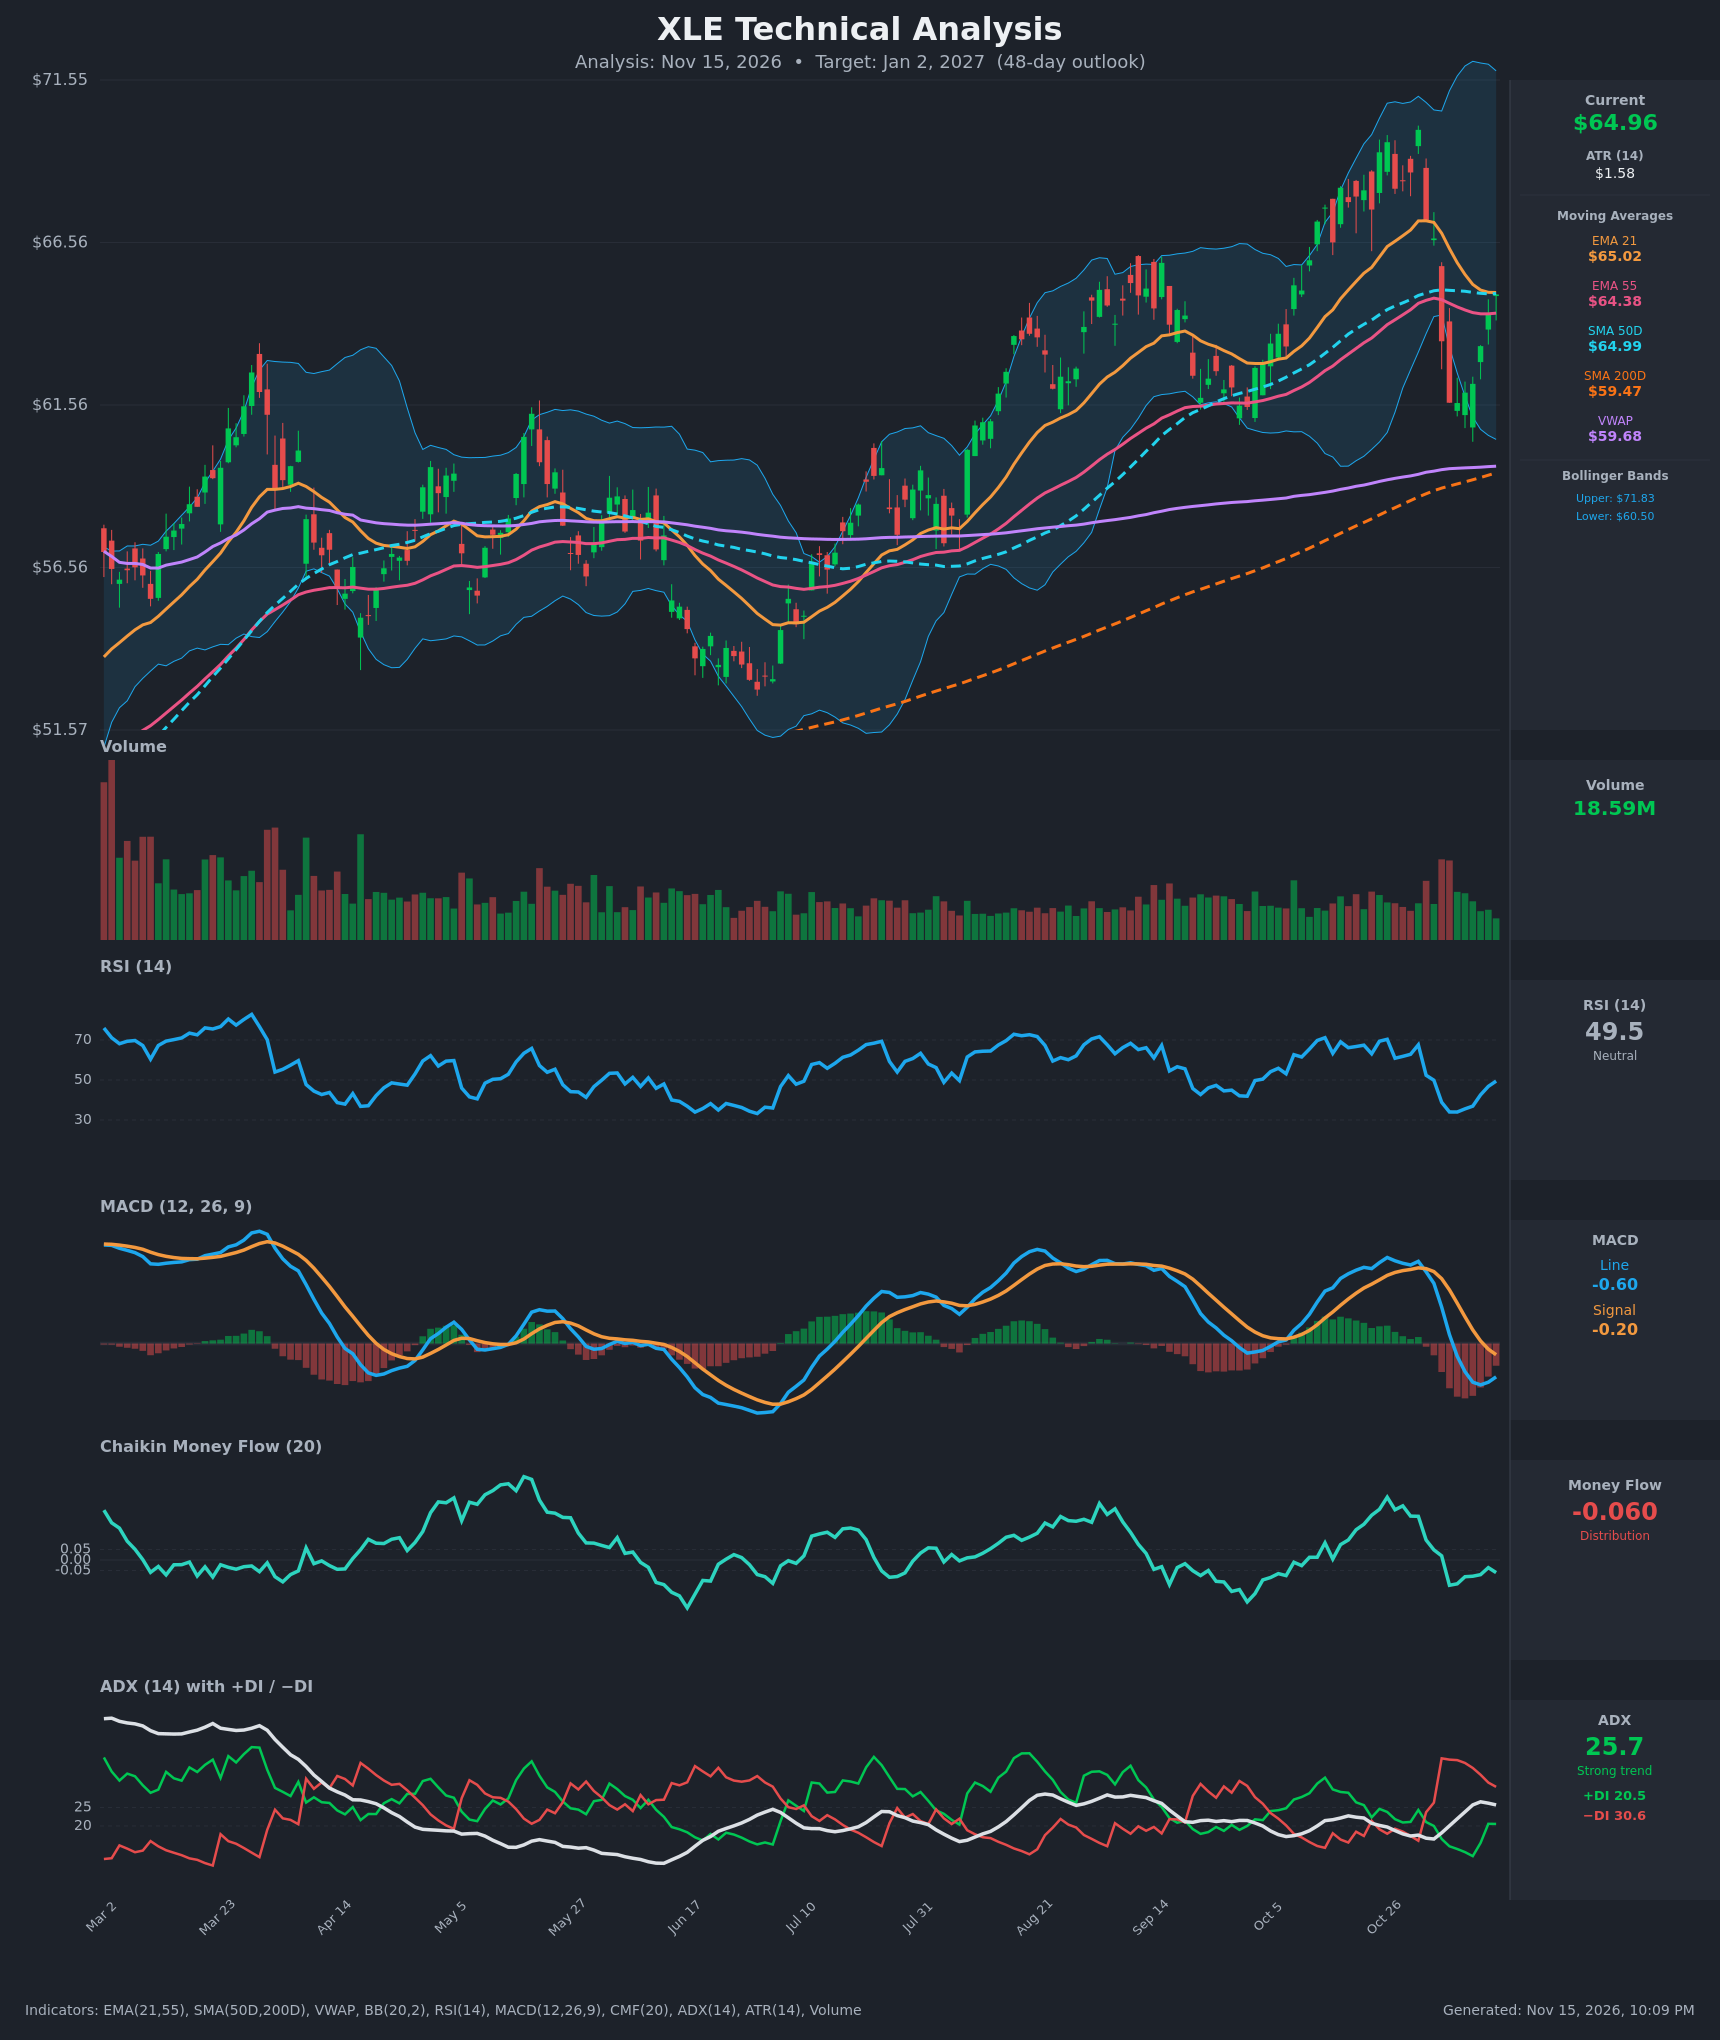
- RSI (14): 49.45, recovering from 34.0 on Nov 5-6 and now back at the midline. Momentum is turning up from oversold-adjacent levels but has not yet confirmed a bullish regime above 50. [Neutral]
- 20 EMA (EMA 21): $65.02, with price at $64.96 sitting right on it. EMA 21 has rolled over from $67.22 but is flattening. It is also converging with SMA50D ($64.99) and sits above EMA55 ($64.38), so there is no bearish EMA cross. Price needs to close above this cluster to turn it into support. [Neutral]
- MACD: Line -0.597 is below signal -0.200, so it is still in a bearish crossover state after crossing down on Nov 6. The histogram is about -0.40, improving from about -0.79 on Nov 11, and the line has turned up from -0.740. That is early bullish momentum repair, but no cross has occurred yet. [Bearish]
- Bollinger Bands (20): Upper $71.83, lower $60.50, midline roughly $66.2. Price bounced from near the lower band (about $61.6) and now sits in the lower half of the bands, below the midline. The bands are wide after the October spike and selloff, so volatility is elevated. [Neutral]
- CMF (20): -0.060, just below the -0.05 threshold and down from +0.30 in late October. That is mild distribution. It has stabilized in the -0.03 to -0.12 range rather than collapsing further. [Distribution]
- ADX (14): 25.7, with -DI 30.6 above +DI 20.5. Bears are still in control and the trend reading is "strong", but ADX is slipping from 26.5 and -DI is falling from 38.3. Meanwhile +DI has risen from 11.8 to 20.5, so the selloff is losing strength. [Strong Trend - Bearish, fading]
- Volume: 18.59M, below the high-volume selloff days of Nov 4-5, and recent up days have printed on moderate volume. The rebound is not yet backed by strong buying. [Neutral / Lack of conviction]
DIVERGENCES & TRENDS
- Price vs. RSI: RSI made a higher low relative to the 30-34 zone seen in June, and the Nov low at 34 held. This is not a formal divergence, but RSI is rebounding with price.
- MACD: The histogram is making higher lows (-0.79 to -0.40) while the line stays below signal. This is a potential bullish cross setup within the next 1-2 weeks if price holds above $64.
- Moving averages: Price is above SMA200D ($59.47, rising) and VWAP ($59.68), so the long-term trend is up. SMA50D is above SMA200D, so the golden cross stays intact. EMA21, EMA55 and SMA50D are compressed between $64.38 and $65.02, which signals a decision point.
- DI lines: -DI remains above +DI, but the gap has narrowed from 26 points to about 10. A +DI/-DI crossover would be a notable bullish trigger.
- CMF: It fell from +0.30 to -0.06 during the pullback. Distribution is mild, and it needs to reclaim +0.05 to confirm buyers.
- Failed push to $70: The October peak was at $69.6-$70.0, with price falling sharply through the 21/55 EMAs and SMA50D in early November. It then recovered to the same MA cluster, a classic retest of broken support.
CHART PATTERNS
- Possible Bearish Double Top / failed breakout: The Oct 26 and Oct 30 highs at about $69.6-$70.0 form a double top. The neckline is near the Nov 5-6 low at about $61.6. That neckline has not broken, so the pattern is unconfirmed. A close below $61.6 would imply a measured move toward roughly $53, which is far larger than this timeframe would likely reach. The target would more realistically stall at the SMA200D/VWAP zone near $59.5.
- Recovery / bullish flag-like base: The V-shaped bounce from $61.6 back to $65 against a rising SMA200D and an uptrend of higher lows since June ($52-53) keeps the larger bullish structure intact. A break above $67.25 would suggest a retest of $70.
- Wide consolidation: From August to October, price ranged about $61-$66 before the spike. The current $61.6-$67.3 zone looks like a mid-range reset inside a larger uptrend.
- Net read: The patterns are mixed. The reversal structure is unconfirmed and the longer-term trend structure is intact, which favors a modest upward bias with a clear failure level at $61.6.
POTENTIAL SCENARIOS
- Scenario 1: Bullish MA Reclaim and Retest of Highs — Price holds the $64.4-$65 cluster, MACD crosses above signal and +DI crosses above -DI as the selloff exhausts. Energy sector strength resumes within the longer uptrend. Trigger: daily close above $65.50 (EMA21/SMA50D), then above $67.25. Target: $67.25 first, then $68.5-$69.5. Invalidation: daily close below $63.00. (45% probability)
- Scenario 2: Bearish Rejection and Retest of Lows — Price fails at the converged MA cluster (a classic retest of broken support), -DI stays dominant and CMF remains negative. Price then breaks below the Nov low and the double-top neckline. Trigger: rejection at $65-$66 followed by a close below $61.60. Target: $59.50-$60.00 (SMA200D/VWAP). Invalidation: close above $67.25. (28% probability)
- Scenario 3: Neutral Range Chop — Price oscillates around the MA cluster as ADX fades below 25 and the MACD flattens. Trigger: repeated closes between $62.50 and $67.00. Target: $64-$66. Invalidation: close outside the $61.60-$67.25 range. (27% probability)
PRICE TARGETS
For the 48-day horizon (ending about Jan 2, 2027):
- Target Price: $66.80
- Expected Range: $60.20 to $70.00 (width $9.80, about 15.1% of current price, consistent with the 30-60 day guidance of 12-18%)
- Key Levels: Support at $61.60 (Nov swing low; EMA55 at $64.38 is the first minor cushion), Resistance at $67.25
OVERALL BIAS
OVERALL BIAS: BULLISH - Price is above the rising SMA200D and VWAP, the MACD histogram and RSI are recovering, +DI is rising while -DI and ADX fade, and price sits right at the EMA21/SMA50D cluster with room toward $67-$70. The bullish lean is modest given the MACD is still below signal, CMF shows mild distribution, and -DI remains above +DI. A close below $61.60 would invalidate it.
This is educational analysis and not financial advice.