XLE 20-day bearish forecast — Nov 15, 2026
- Bias: Bearish
- Timeframe: 20 days (made Nov 15, 2026, target date Dec 4, 2026)
- Price at analysis: $64.96
- Price target: $63.50
- Expected range: $60.70 – $67.20
- Result: Pending — graded after the close on Dec 4, 2026
Get a free AI analysis of XLE today
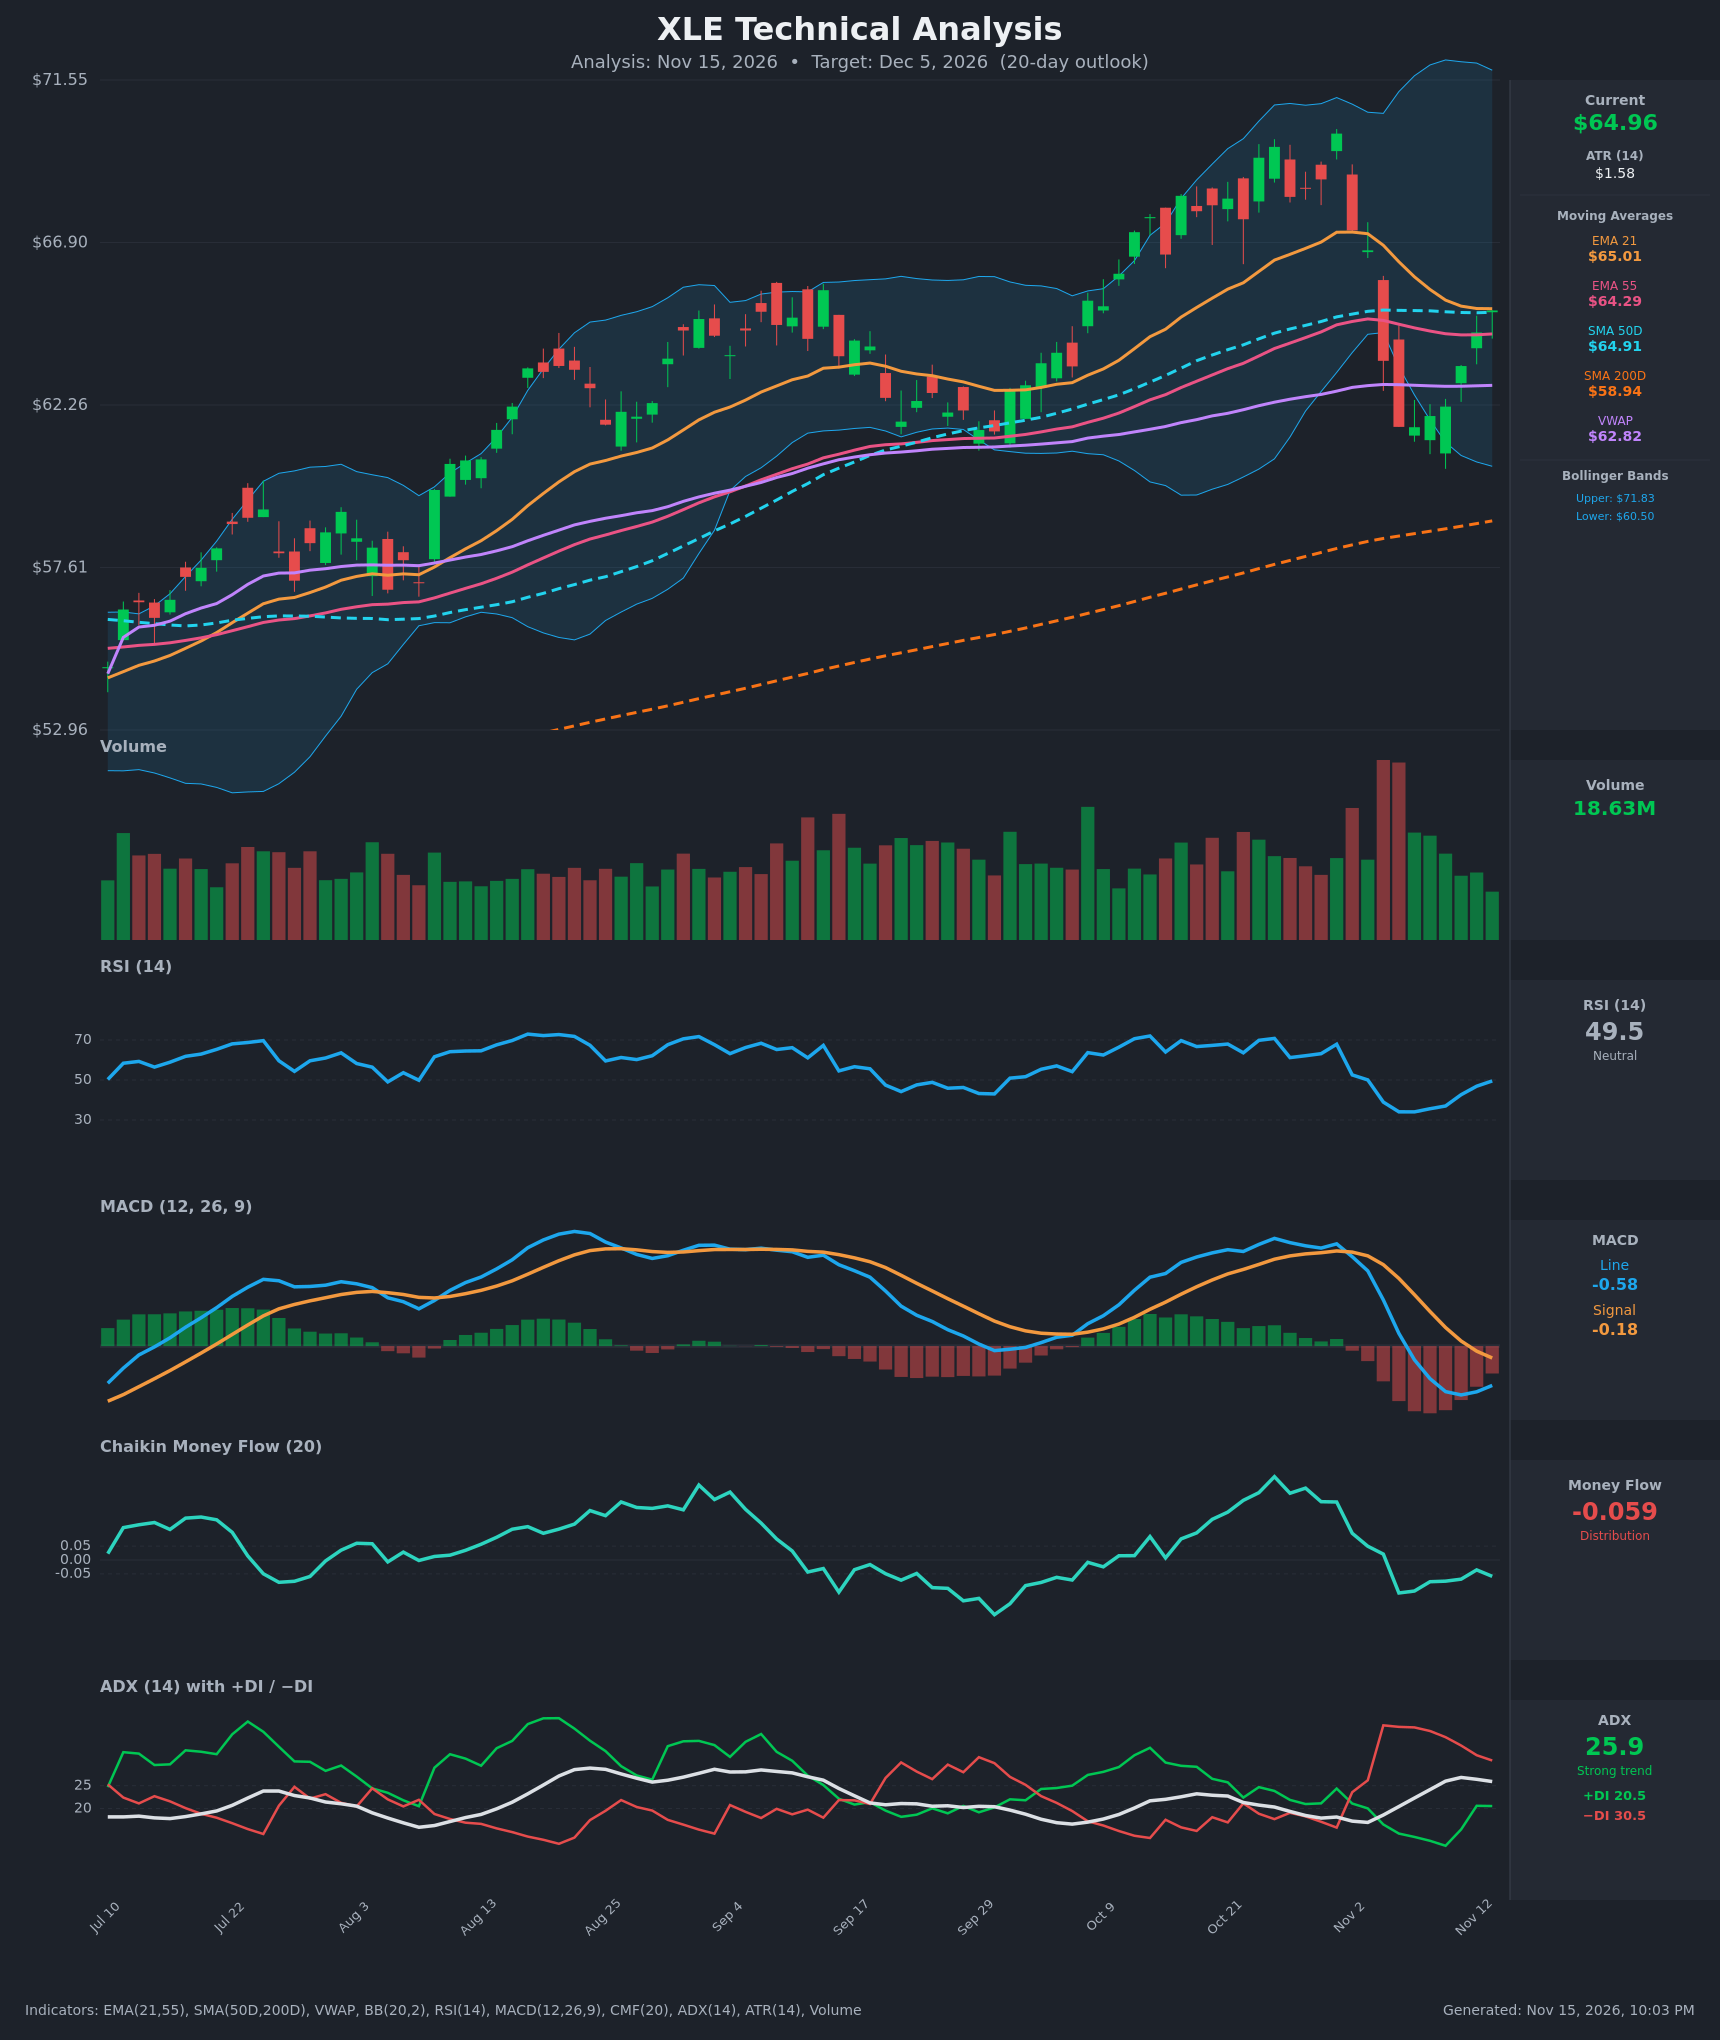
Analysis
TECHNICAL INDICATORS
- RSI (14): 49.53, rising from a 34 low on Nov 5-6 and sitting at the neutral midline. Momentum has recovered, but there is no directional edge yet. [Neutral]
- 20 EMA (21 EMA): $65.01. Price at $64.96 is pinned just under it. The EMA has rolled over from $67.20 and is now acting as overhead resistance. It still sits above EMA55 ($64.29), so no bearish EMA cross has happened yet, but the gap is nearly closed. [Bearish]
- MACD: Line -0.58 is below signal -0.18, after a bearish cross on Nov 6. Both are below zero. The histogram is still negative but contracting (the line has curled up from -0.72), which suggests selling momentum is fading without a bullish cross yet. [Bearish]
- Bollinger Bands (20): Upper $71.83, lower $60.50, with the midline near $66.2. Price has bounced off the lower band and is now below the midline. The bands are wide after the late-October volatility. Mid-band resistance sits about $1.2 above. [Neutral]
- CMF (20): -0.059, just below the -0.05 threshold. It has moved from +0.30 in late October to mild distribution, and it is still weak despite the 5-day price bounce. [Distribution]
- ADX (14): 25.9, just above the strong-trend threshold, with −DI (30.5) above +DI (20.5), so bears are in control. ADX is easing (26.8 → 25.9) and the DI spread has narrowed from ~25 points to ~10, so the downtrend is losing steam. [Strong Trend – Bearish, weakening]
- Volume: 18.63M, below the heavy-selling spikes of early November. The bounce came on moderate, declining volume, so there is little conviction behind it. [Neutral to mildly Bearish]
DIVERGENCES & TRENDS
- CMF vs. price: Price has risen about 5.4% off the Nov 6 low ($61.62 → $64.96), but CMF stays negative and below -0.05. This is a mild bearish divergence: the bounce lacks accumulation.
- MACD: The histogram is improving (less negative) while the line remains below the signal. This is early stabilization, not a buy signal.
- DI/ADX: −DI peaked at 38 and has faded to 30.5, while +DI recovered from 11.9 to 20.5. The sell-off is exhausting, but the DIs have not crossed.
- Moving-average confluence: Price is testing EMA21 ($65.01) and SMA50 ($64.91) together from below, with EMA55 ($64.29) just beneath. The Nov 4 breakdown sliced through all of them.
- Long-term trend: Price is well above SMA200 ($58.94, still rising) and above VWAP ($62.82). The golden cross is already in place (SMA50 > SMA200), so the larger structure remains constructive.
- Pullback depth: The bounce has retraced about 40% of the $70.02 → $61.62 drop. The 50-61.8% zone sits at $65.8-$66.8, which is where overhead supply would be expected.
CHART PATTERNS
- Bearish Head and Shoulders / Double Top (loose): The late-October peaks at ~$69-70 followed by the sharp breakdown through the 50-day and 55-EMA resemble a topping structure. The neckline break was around $64-65, and the current bounce looks like a retest from below. Measured-move targets point toward $60-61, near the lower Bollinger Band and the Nov 5-6 lows.
- Bearish Flag / Pennant (potential): The 5-bar rebound after the vertical drop could be a bearish flag. The pattern has few bars, so confirmation is limited. A rejection here would project toward $60-61.
- Counter-view: A V-shaped recovery that reclaims $65-66 on volume would invalidate the retest thesis and re-expose the $67-$70 range.
POTENTIAL SCENARIOS
- Scenario 1: Bearish Rejection at MA Cluster — Price fails at the EMA21/SMA50 confluence ($65-$65.8), the MACD stays below its signal, and −DI remains dominant. The pullback fades toward VWAP and then the lower band area. Trigger: daily close below $64.29 (EMA55). Target: $62.80 first (VWAP), then $60.80-$61.60. Invalidation: daily close above $66.90 on rising volume. (45% probability)
- Scenario 2: Bullish Reclaim and Recovery — Price closes above the EMA21/SMA50 cluster, RSI pushes above 55, MACD crosses back above its signal, and CMF turns positive. Price then rallies toward the Bollinger midline and the previous gap area. Trigger: close above $65.80 with a volume pickup. Target: $67.00-$68.50. Invalidation: close back below $64.00. (40% probability)
- Scenario 3: Neutral Range Chop — Price oscillates between the MAs and VWAP ($62.80-$66.00) as ADX fades below 25. Trigger: ADX falls under 22 with overlapping candles. Target: $64.00-$65.50. Invalidation: close outside $62.50-$66.50. (15% probability)
PRICE TARGETS
- Target Price: $63.50 (20-day horizon, Dec 5, 2026)
- Expected Range: $60.70 to $67.20. Width is $6.50, about 10% of the current price, which fits the 14-21 day guidance of 8-12%.
- Key Levels: Support at $62.82 (VWAP; then $61.60 swing low), Resistance at $66.90 (prior breakdown area and Bollinger midline).
OVERALL BIAS
OVERALL BIAS: BEARISH - Price is stalled at the EMA21/SMA50 resistance cluster, with MACD below its signal, −DI well above +DI, and CMF showing distribution despite the bounce. The structure above SMA200 limits downside, so conviction is modest, with a pullback toward VWAP/$63.50 favored over a breakout.
This is educational analysis and not financial advice.