XLE 27-day bullish forecast — Nov 15, 2026
- Bias: Bullish
- Timeframe: 27 days (made Nov 15, 2026, target date Dec 11, 2026)
- Price at analysis: $64.96
- Price target: $66.20
- Expected range: $60.80 – $69.80
- Result: Pending — graded after the close on Dec 11, 2026
Get a free AI analysis of XLE today
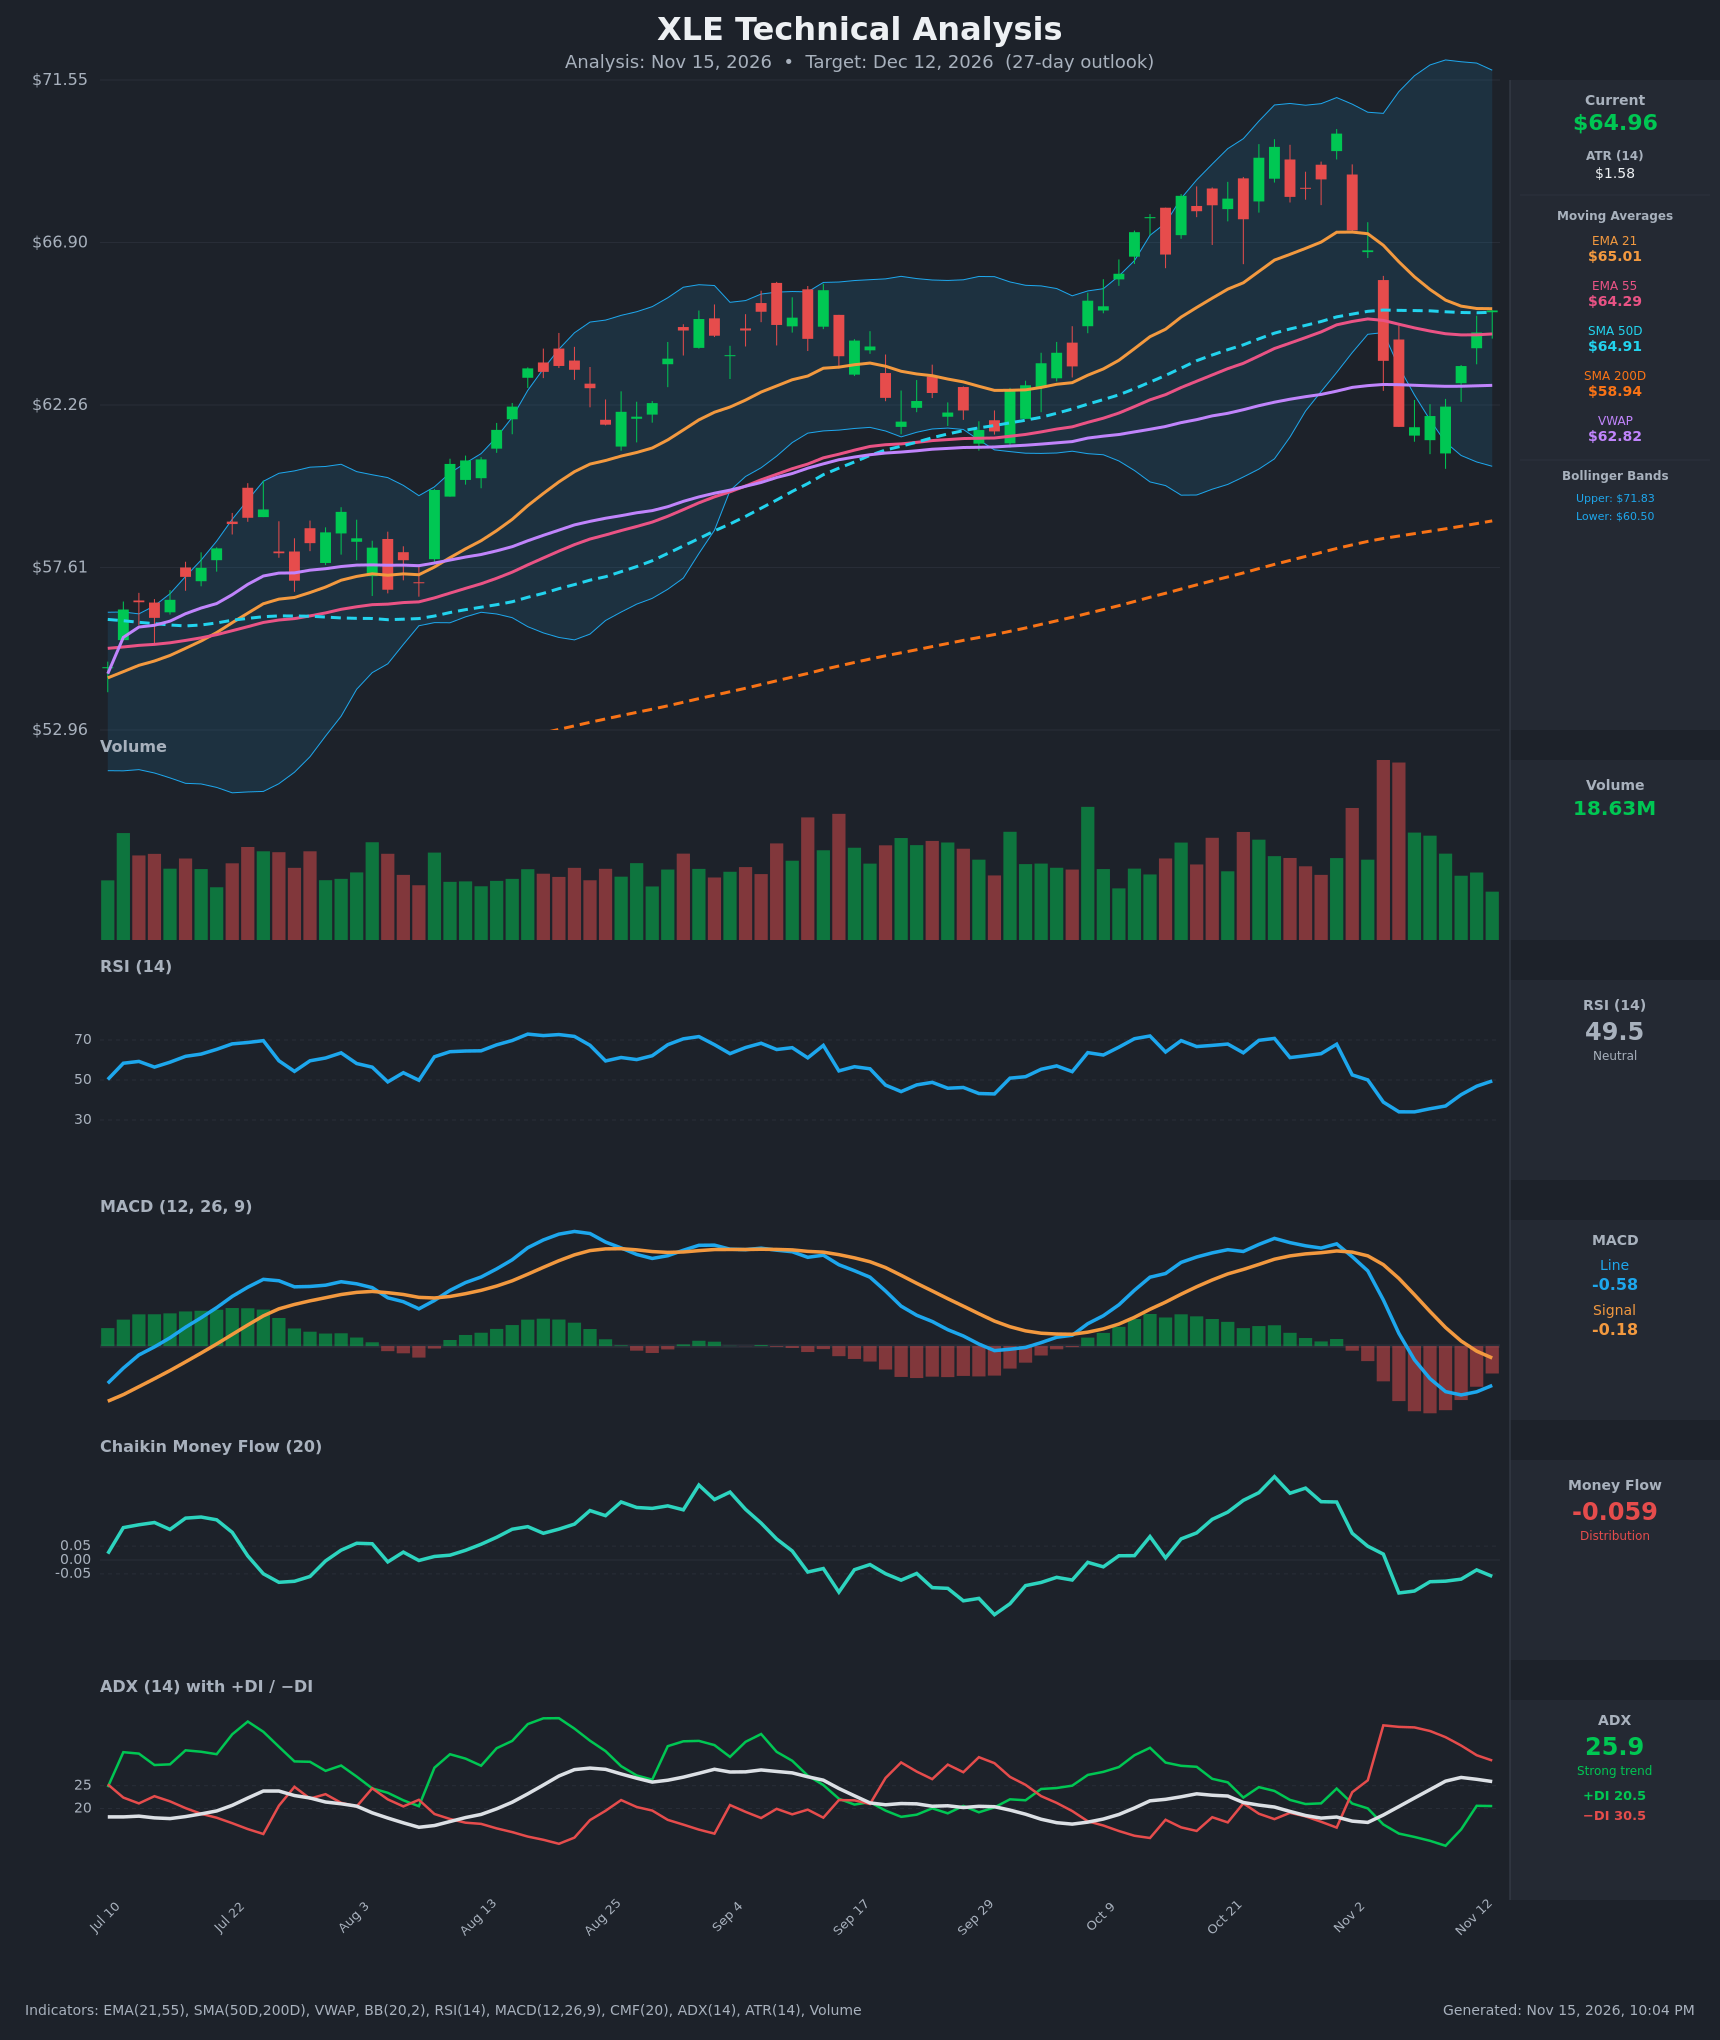
Analysis
TECHNICAL INDICATORS
- RSI (14): 49.5, right at the midline. It has rebounded from 34.1 on Nov 5-6 and is rising steadily, so downside momentum has faded without yet turning bullish. [Neutral]
- 20 EMA: The EMA 21 is $65.01 and price ($64.96) sits just under it. It has rolled over from $67.20, but the decline is flattening as price catches up. Price is above the EMA 55 ($64.29) and SMA 50 ($64.91) but still testing the EMA 21 as resistance. [Neutral]
- MACD: The line is -0.58 and the signal is -0.18, so the line is still below the signal (bearish crossover on Nov 6). The gap has narrowed from about -0.80 to -0.40 in three bars, and the histogram is shrinking. A bullish crossover looks likely within days if the bounce holds. [Neutral]
- Bollinger Bands (20): Upper $71.83, lower $60.50, midline about $66.17. The bands are wide after the October volatility. Price bounced off the lower band (about $61.6 low) and is now below the midline, which is the first upside magnet. [Neutral]
- CMF (20): -0.059, just below the -0.05 threshold. It has recovered from about -0.12 but is still marginally negative, which is mild distribution. [Distribution]
- ADX (14): 25.9 and slipping from 26.8, with −DI (30.5) above +DI (20.5). The trend is technically strong and bearish, but the gap is closing: −DI is down from 38 and +DI is up from 12.9. The downtrend is losing force. [Strong Trend – Bearish, fading]
- Volume: 18.63M, lighter than the heavy selling-volume spike during the Nov 4-5 breakdown. Volume on the bounce is moderate and unremarkable, so there is no strong conviction from buyers yet. [Neutral]
DIVERGENCES & TRENDS
- No clean RSI/price divergence. The RSI low (34) and the price low (about $61.6) coincided, so this is a normal oversold bounce.
- The MACD-to-signal gap is converging (-0.80 → -0.60 → -0.40), which is an early bullish momentum shift.
- The DI spread is narrowing: −DI fell from 38 to 30.5 while +DI rose from 12.9 to 20.5. A +DI/−DI crossover is possible within 1-2 weeks if the rally holds.
- Price is at a confluence of EMA 21 ($65.01), SMA 50 ($64.91) and a flat/declining trend line. It reclaimed the EMA 55 and VWAP ($62.82), but the EMA 21 and SMA 50 are the immediate test.
- The SMA 200 ($58.94) is rising and well below price, so the long-term uptrend is intact. The EMA 21 is still above the EMA 55 (no bearish cross), but the gap is nearly closed ($65.01 vs $64.29) and a cross is close.
- CMF is still negative, which does not yet confirm the bounce.
CHART PATTERNS
- Bearish double top (reference diagram): the Oct 26/Oct 30 highs near $69.6-$70.0 resemble a double top. The rapid drop to $61.6 broke below the intermediate support area. The measured move (about $8.4) would project toward the mid-$50s. The pattern is only partially valid because price has recovered much of the breakdown and is back at the moving averages, which makes this look more like a failed or retesting breakdown.
- Possible bullish reversal / retest: the sharp V-shaped bounce from the lower Bollinger Band back to the 21/50-period averages. If price clears $65.0-$66.9, the double-top thesis is largely invalidated, and the targets are the BB midline ($66.17) and the $66.90 level, then the $69-$70 highs.
- Near-term, price is in a decision zone. A rejection here would form a lower high, a bearish continuation setup.
POTENTIAL SCENARIOS
- Scenario 1: Bullish Reclaim and Mean Reversion — Price holds the EMA 55 / SMA 50 area, MACD crosses above its signal, and +DI crosses above −DI, pushing price to the Bollinger midline and the prior consolidation zone. Trigger: daily close above $65.50 on improving volume. Target: $66.20-$67.50, with an extension to $69.00. Invalidation: daily close below $63.00. (45% probability)
- Scenario 2: Bearish Rejection / Double-Top Continuation — Price fails at the EMA 21 / SMA 50 confluence, forms a lower high, and rolls over as −DI stays dominant and CMF stays negative. Trigger: rejection at $65-$66 followed by a close below $64.29 (EMA 55) and then $62.80 (VWAP). Target: $61.50, then $60.50 (lower band), with an extension toward $59 (SMA 200). Invalidation: close above $66.90. (35% probability)
- Scenario 3: Neutral Chop — Price oscillates around the 64-66 moving-average cluster while ADX declines. Trigger: ADX falls below 20 and price stays between $63 and $66.90. Target: $64-$66. Invalidation: a close outside $62.50-$67.00. (20% probability)
PRICE TARGETS
- Target Price: $66.20 (27-day, near the Bollinger midline)
- Expected Range: $60.80 to $69.80 (width $9.00, about 13.9% of the current price, consistent with 30-60 day-style scaling for 27 days)
- Key Levels: Support at $64.29, Resistance at $66.90
OVERALL BIAS
OVERALL BIAS: BULLISH - The bounce off the lower Bollinger Band has reclaimed the EMA 55, SMA 50 and VWAP. The MACD gap is closing, RSI is rising, the DI spread is narrowing, and price remains well above the rising SMA 200. The case is modest because −DI still leads, CMF is slightly negative, and price is testing the EMA 21 / SMA 50 resistance. That leaves a meaningful chance of a lower high.
This is educational analysis and not financial advice.