XLE 6-day bullish forecast — Nov 1, 2026
- Bias: Bullish
- Timeframe: 6 days (made Nov 1, 2026, target date Nov 6, 2026)
- Price at analysis: $70.00
- Price target: $70.80
- Expected range: $68.60 – $73.10
- Result: Incorrect (-11.7%) — closed at $61.83 on Nov 6, 2026; quality score 0/100
Get a free AI analysis of XLE today
Analysis
TECHNICAL INDICATORS
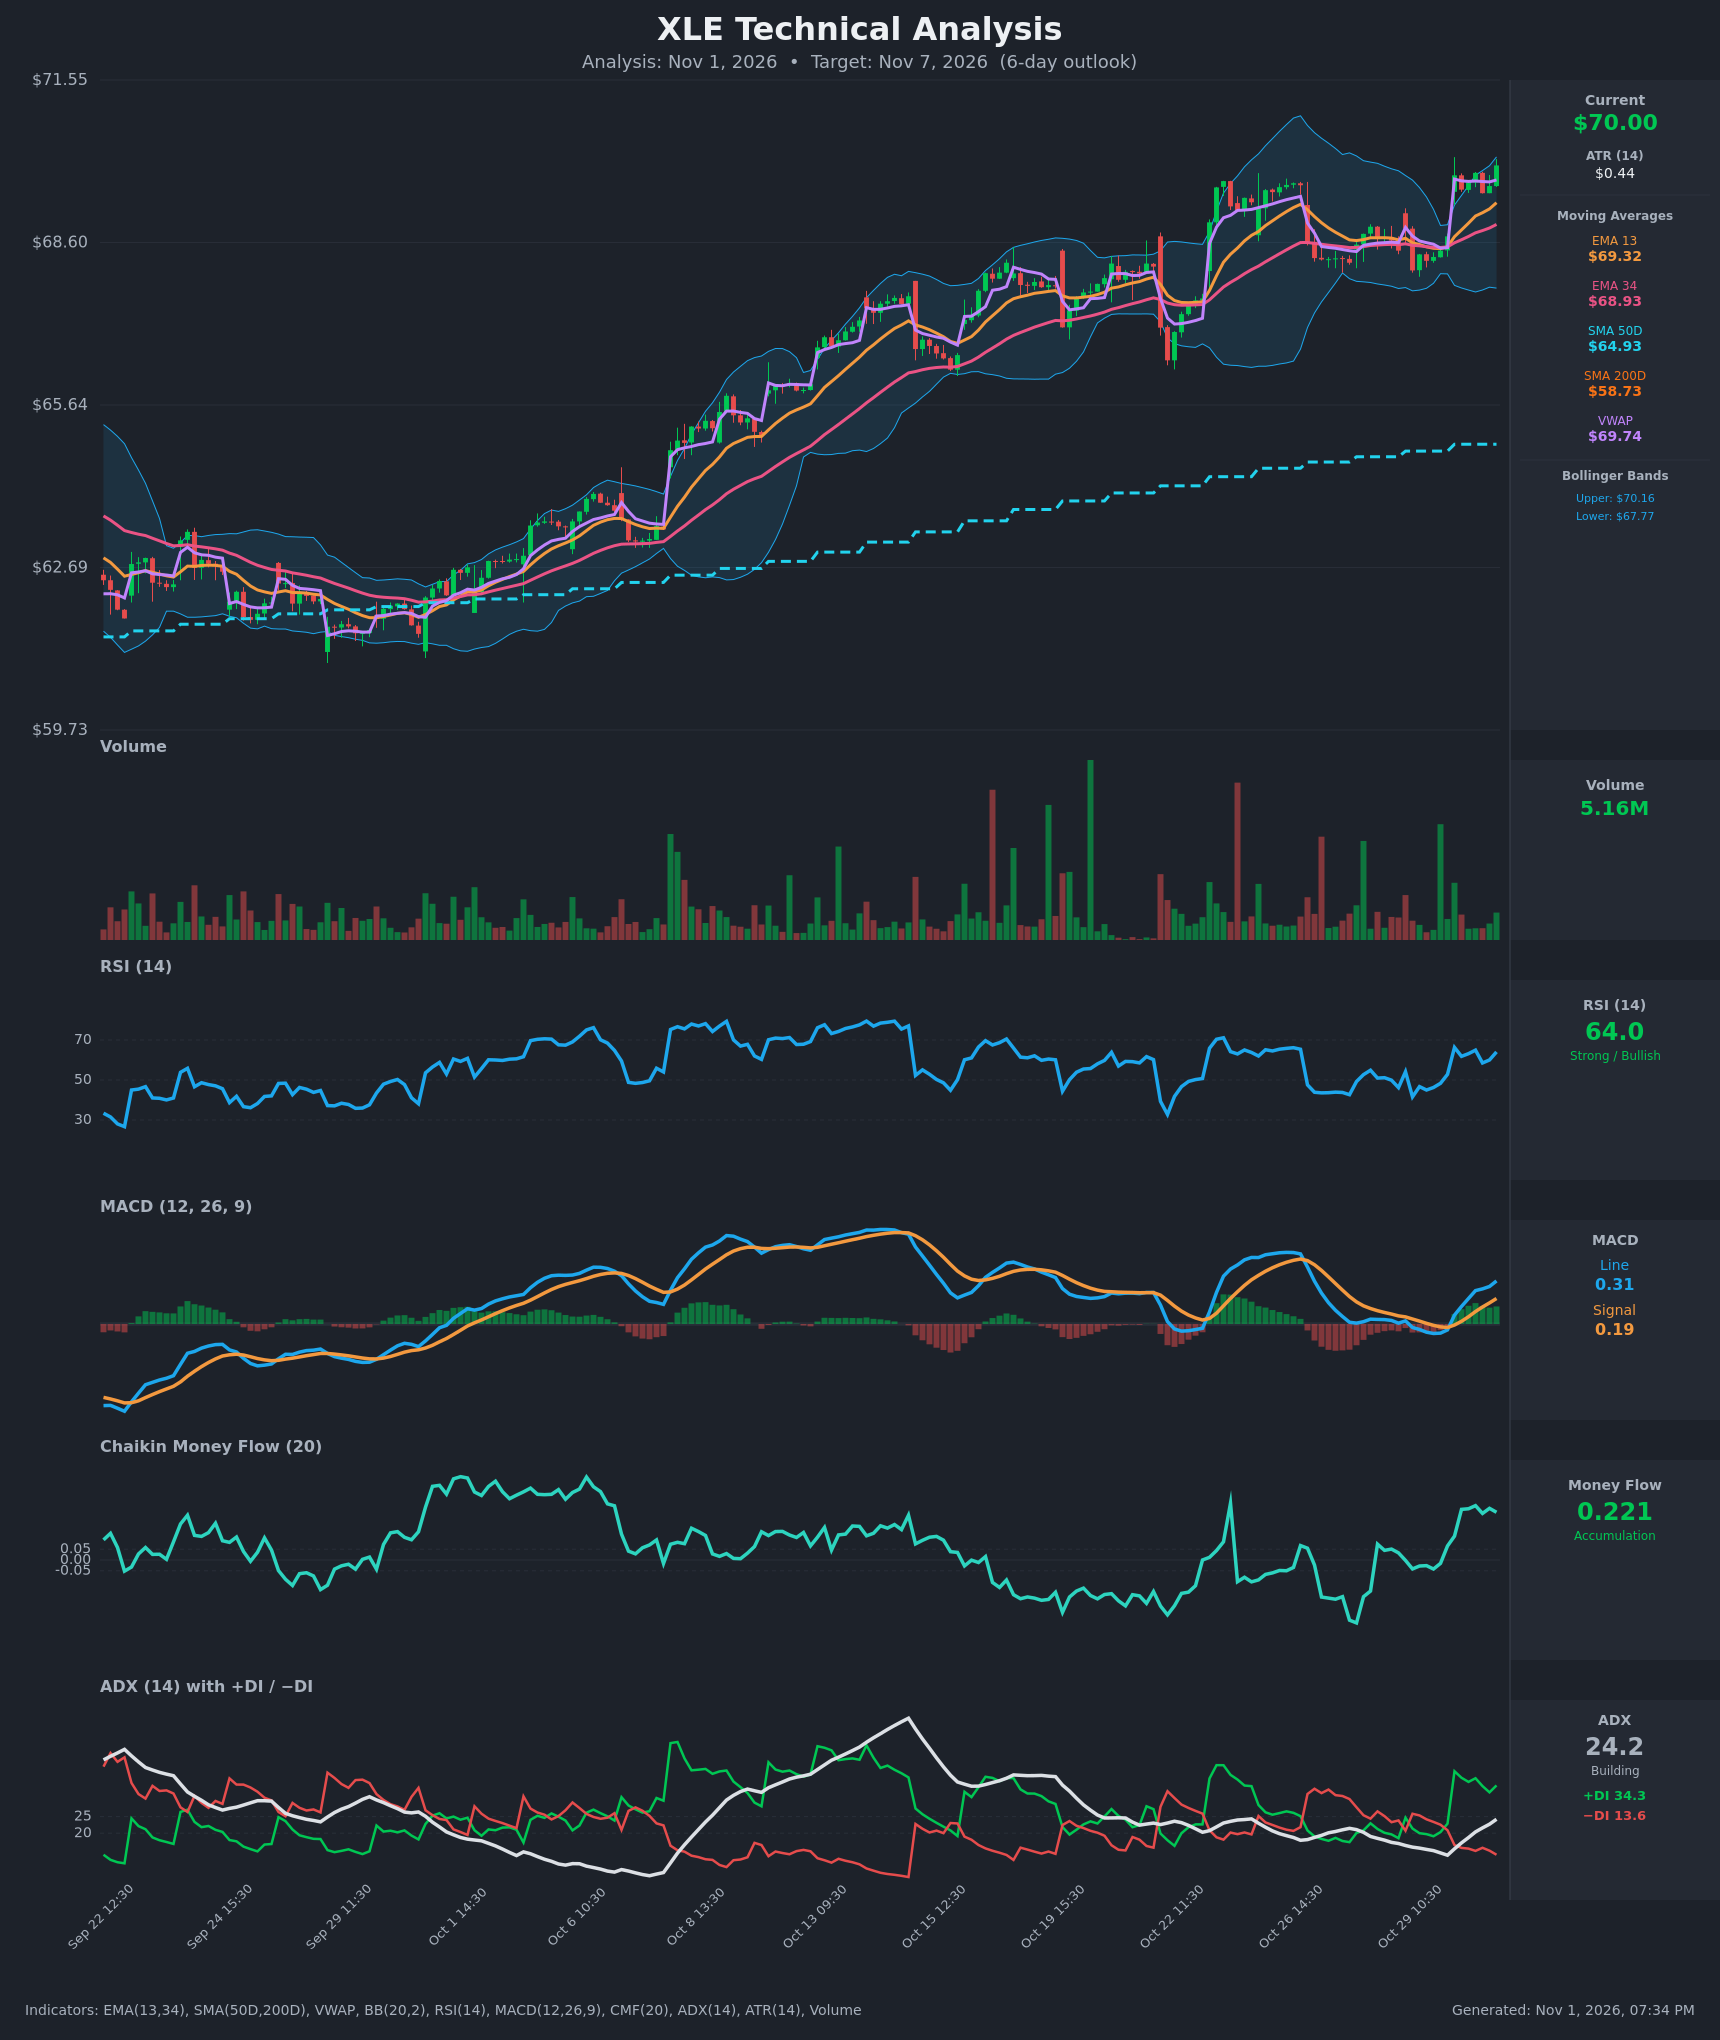
- RSI (14): 64.04, up from the mid-40s on Oct 29 and below the 70 overbought line. Momentum is rising and has room to run before overbought. [Bullish]
- EMA 13 / EMA 34: EMA 13 is $69.32 and EMA 34 is $68.93. Price at $70.00 is above both, and EMA 13 is above EMA 34 (a recent bullish re-cross after the Oct 29 flattening). Price is also well above SMA50D ($64.93) and SMA200D ($58.73), and SMA50D is above SMA200D (golden cross already in place). [Bullish]
- MACD: Line 0.313 is above Signal 0.186 with a widening positive histogram. The bullish crossover happened on Oct 30 at the open. The line is still below the early-to-mid October peak, so momentum is recovering but not at its high. [Bullish]
- Bollinger Bands (20): Upper $70.16, lower $67.77, mid about $68.96. Price at $70.00 is hugging the upper band (about 94% of the band width). This signals strength, but it is also a short-term stretched condition that can lead to a pause or pullback to the midline. The bands are widening after the gap-up. [Bullish]
- CMF (20): 0.221, well above +0.05 and rising from near zero on Oct 29, which shows solid accumulation. [Accumulation]
- ADX (14): 24.2 and rising, just under the 25 trend-strength threshold. +DI 34.3 is far above −DI 13.6, so bulls are firmly in control and the trend is about to qualify as strong. [Strong Trend building – Bullish]
- Volume: 5.16M, roughly average. The Oct 30 gap-up had above-average volume, and the follow-through hourly bars have been moderate. Buying is not heavy, but the advance is not being sold into on notable volume. [Moderately supportive]
- VWAP: $69.74, with price above it. Buyers hold the intraday edge. [Bullish]
DIVERGENCES & TRENDS
- No bearish RSI or MACD divergence. RSI (64) and MACD are both rising alongside price, and neither has reached the highs they hit in mid-October, so momentum has room to catch up.
- The Oct 30 morning gap from about $68.7 to $69.8 broke a multi-day consolidation under $69 and resolved it higher.
- The MACD bullish crossover, the EMA 13 > EMA 34 relationship, and the +DI surge all occurred together, which confirms the breakout.
- ADX is rising from a low base (13 to 24), which suggests a new trend leg is forming.
- Price is pressing the upper Bollinger Band, and the 6-day horizon makes a shallow pullback toward VWAP/EMA 13 (~$69.3-69.7) plausible before continuation.
- The long-term trend is intact: price is above SMA200D with a rising SMA50D, in a staircase of higher highs and higher lows since late September.
CHART PATTERNS
- Consolidation breakout (Bullish Flag / Pennant-like): After the Oct 22-28 advance, price consolidated sideways between about $68 and $69, then broke out with the gap on Oct 30. This resembles the Bullish Flag/Pennant continuation pattern. The measured move from the prior leg (about $66.5 to $69.5, roughly $3) suggests an eventual target in the low $71s or higher, but a 6-day window likely captures only part of that.
- The broader structure is an ascending channel of higher highs and higher lows.
- No reversal pattern (double top, head and shoulders) is visible. The prior high near $70.2 could act as a minor double-top risk if price stalls here.
POTENTIAL SCENARIOS
- Scenario 1: Bullish Breakout Continuation — Price holds above the $69.30-69.70 VWAP/EMA 13 zone and extends the flag breakout, supported by ADX crossing 25 and CMF accumulation. Trigger: hourly close above $70.20 (upper Bollinger Band / prior high). Target: $71.20-71.50. Invalidation: close below $68.90 (EMA 34). (55% probability)
- Scenario 2: Neutral Pause / Pullback Then Recovery — Price is stretched at the upper band and digests gains, retesting $69.30-69.70 and chopping within $69-70.5 before drifting up. Trigger: rejection at $70.20 with RSI easing to the 55-60 area. Target: $69.50-70.50. Invalidation: close above $70.50 or below $68.90. (28% probability)
- Scenario 3: Bearish Failed Breakout — The gap fills and price falls back into the prior $68-69 range, a bull trap at the upper band. Trigger: break below $69.30 with MACD histogram rolling over. Target: $68.40-68.80. Invalidation: reclaim of $70.00. (17% probability)
PRICE TARGETS
For the 6-day timeframe, the range width guide is ~4-8% of the current price. I use about $4.50 wide, or 6.4%. ATR of $0.44 on hourly bars, scaled to 6 sessions, supports a similar range.
- Target Price: $70.80 (6 days)
- Expected Range: $68.60 to $73.10 (width $4.50, about 6.4%)
- Key Levels: Support at $69.30 (EMA 13/VWAP zone, with the EMA 34 at $68.93 below it), Resistance at $70.16 (upper Bollinger Band, prior high), then $71.50
OVERALL BIAS
OVERALL BIAS: BULLISH - Price broke out of a consolidation flag with a fresh MACD bullish crossover, EMA 13 above EMA 34, strong CMF accumulation (0.22), and +DI far above −DI with ADX rising toward 25, all inside a long-term uptrend above SMA50D/SMA200D. The upper-band extension argues for a possible brief pullback, but the weight of evidence favors continuation.
This is educational analysis and not financial advice.