SMCI 4-day bullish forecast — Nov 1, 2026
- Bias: Bullish
- Timeframe: 4 days (made Nov 1, 2026, target date Nov 4, 2026)
- Price at analysis: $32.95
- Price target: $33.40
- Expected range: $32.10 – $33.90
- Result: Incorrect (-10.5%) — closed at $29.50 on Nov 4, 2026; quality score 0/100
Get a free AI analysis of SMCI today
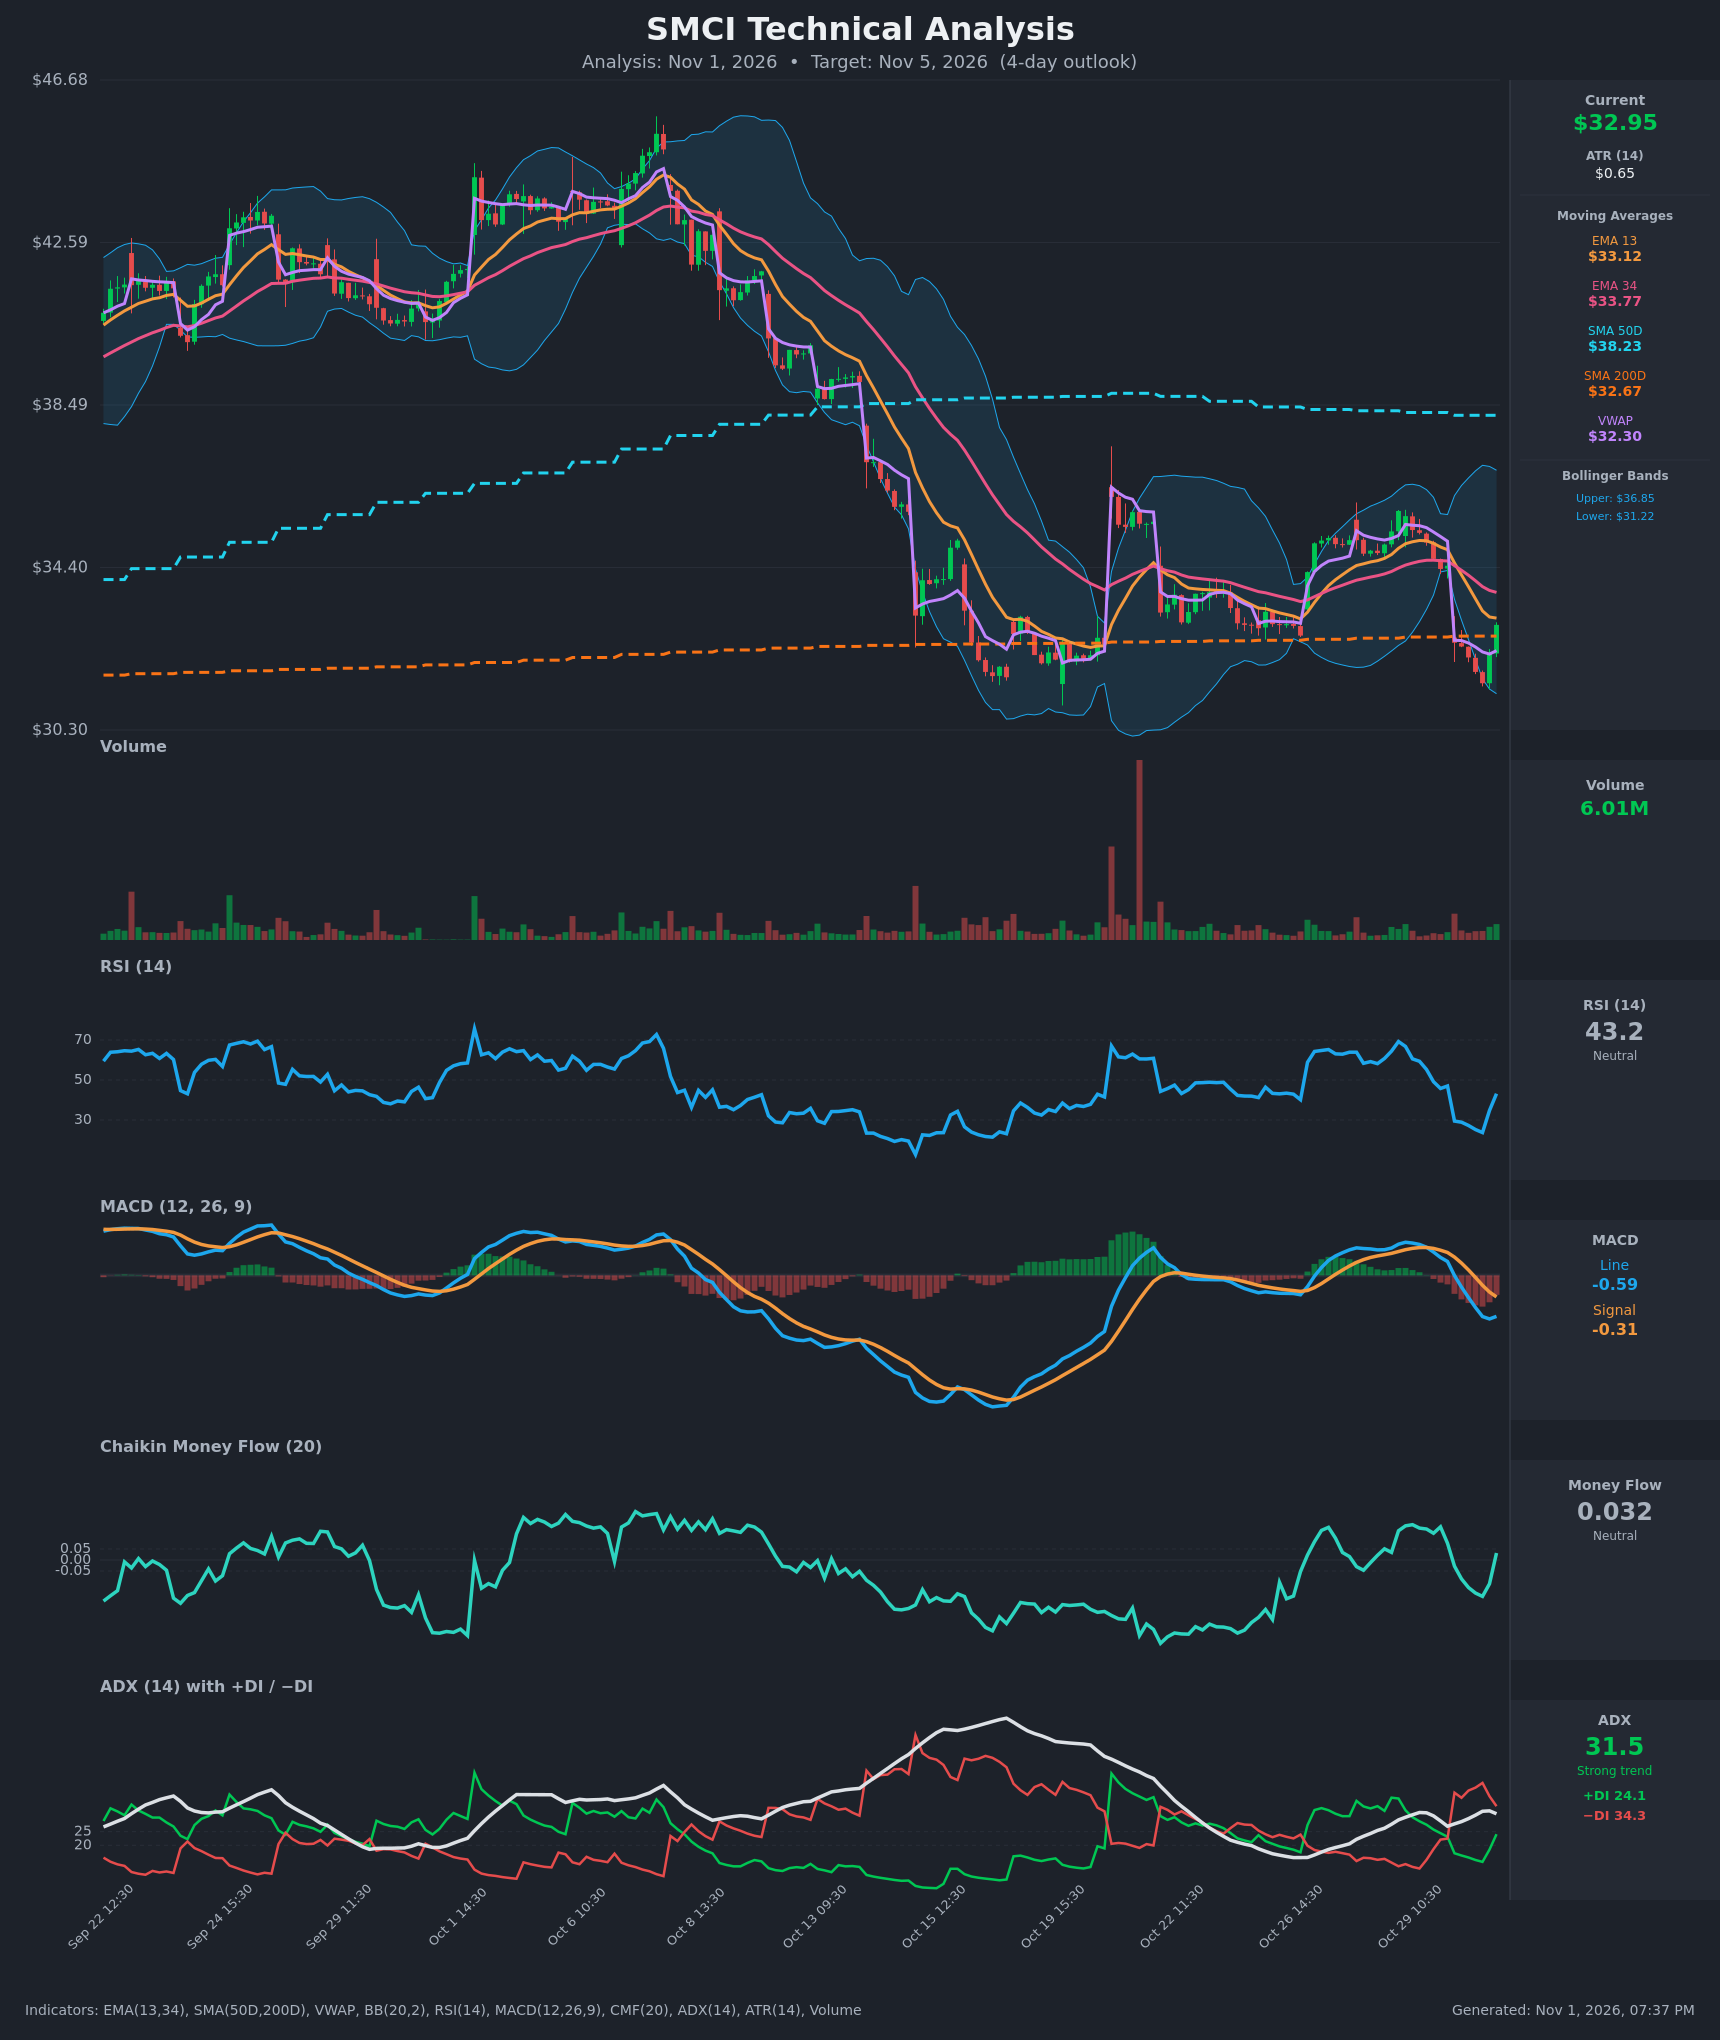
Analysis
TECHNICAL INDICATORS
- RSI (14): 43.15, up sharply from an oversold 23.7 at the Oct 30 13:30 bar. Momentum is recovering, but RSI is still below 50 and has not yet confirmed a trend change. [Neutral]
- 20 EMA: The chart shows EMA 13 at $33.12 and EMA 34 at $33.77. Price at $32.95 is below both, and EMA 13 crossed below EMA 34 on Oct 30 (a bearish cross). Both averages are now overhead resistance. [Bearish]
- MACD: Line -0.589 is below signal -0.309, and the histogram is about -0.28. The line crossed below the signal on Oct 30 12:30. The line ticked up from -0.626 to -0.589 on the last bar, so downside momentum is stalling but no bullish cross has occurred. [Bearish]
- Bollinger Bands (20): Upper $36.85, lower $31.22, midline about $34.03. Price touched the lower band area at $31.48 and bounced back into the lower half. This is a classic oversold-reversion setup, but the bands are wide, so volatility is elevated. [Neutral]
- CMF (20): 0.032, which is neutral. It recovered from -0.166 to positive territory in two bars, which shows buying interest on the bounce. It has not yet cleared the +0.05 accumulation threshold. [Neutral]
- ADX (14): 31.5 with −DI 34.3 above +DI 24.1. This is a strong trend, but the spread has narrowed from 39 vs 16 (Oct 30 open) to 34 vs 24, and ADX has started to roll over from 32.6. The trend is still bearish but fading. [Strong Trend – Bearish, weakening]
- Volume: 6.01M, with the latest bar green and volumes rising into the bounce. This is not a capitulation spike, so the reversal has only moderate confirmation. [Mild buying on bounce]
Other levels:
- Price sits just above SMA200 ($32.67), which it held on a closing basis.
- Price is above VWAP ($32.30), which is a short-term positive.
- SMA50D ($38.23) is far overhead, and price is in a longer-term downtrend from the ~$46 peak.
DIVERGENCES & TRENDS
- Short-term momentum: RSI made a clear low (23.7) and recovered quickly while price printed a low of ~$31.48. The bounce reclaimed both SMA200 and VWAP.
- Histogram: MACD is bearish but the line has stopped falling. A histogram bottom would be an early sign of exhaustion.
- Trend: The Oct 30 gap down from $34.44 to $32.50 broke the Oct 22–29 consolidation, and −DI jumped above 39. The DI spread is now closing, so sellers are losing control.
- Crossovers: EMA 13/34 turned bearish and MACD turned bearish. The longer-term picture remains negative, since price is below SMA50D and the 50-day is rolling over toward the 200-day. No golden or death cross is imminent.
- Gap: The gap-fill zone at $34.44 and the EMA 34 at $33.77 are natural magnets if the bounce extends.
CHART PATTERNS
- Bearish Flag/Rising Wedge: The Oct 22–29 consolidation was a rising channel that broke down with a gap, consistent with the bearish continuation patterns on the reference diagram. The measured move down was largely achieved at the $31.48 low.
- Possible Double Bottom: The $31.2–31.5 area was also tested around Oct 17–21 and held near the same level. A double-bottom (Bullish Double Bottom) interpretation requires a break above the intermediate neckline near $34.4, which is far from confirmed. The first target would be around $34.0–34.4.
- Support zone: The $31.2–$32.7 zone (lower Bollinger Band + SMA200) is a base. A close below $31.2 would invalidate the reversal idea and open $30.30 and lower.
POTENTIAL SCENARIOS
- Scenario 1: Bullish Oversold Relief Bounce — Price holds SMA200 and VWAP, and the DI spread keeps narrowing. The bounce extends toward the EMA cluster and the gap-fill area. Trigger: hourly close above EMA 13 ($33.12) and then EMA 34 ($33.77). Target: $33.60–$34.00. Invalidation: close below $32.30 (VWAP/SMA200 loss). (45% probability)
- Scenario 2: Bearish Rejection and Trend Continuation — The bounce stalls at the EMA 13/34 resistance, the −DI-dominant trend (ADX >30) resumes, and price retests the lows. Trigger: rejection at $33.1–33.8, then a break under $32.30. Target: $31.30–$31.50 (lower band), with $30.30 if it breaks. Invalidation: close above $33.80. (40% probability)
- Scenario 3: Neutral Chop Around SMA200 — Price oscillates between $32.30 and $33.50 as the bounce and the downtrend offset each other. Trigger: low-volume, overlapping candles. Target: ~$32.90. Invalidation: a decisive close outside $32.0–$33.8. (15% probability)
PRICE TARGETS
Timeframe: 4 days. The range width is ($33.90 − $32.10) = $1.80, which is about 5.5% of the current price. That is appropriate for a 4-day window and about 2.8 ATR (ATR is $0.65 daily on the hourly series).
- Target Price: $33.40
- Expected Range: $32.10 to $33.90
- Key Levels: Support at $32.67 (SMA200; $32.30 VWAP as secondary), Resistance at $33.77 (EMA 34; the EMA 13 at $33.12 is the first hurdle)
OVERALL BIAS
OVERALL BIAS: BULLISH - Price bounced sharply from oversold (RSI 23.7 → 43) off the lower Bollinger Band, reclaimed SMA200 and VWAP, CMF turned positive, and the DI spread is narrowing. This is a modest-conviction call, since price remains below both EMAs with MACD bearish and −DI on top, so the upside is likely capped near the EMA 34/gap area.
This is educational analysis and not financial advice.