SMCI 83-day bearish forecast — Nov 15, 2026
- Bias: Bearish
- Timeframe: 83 days (made Nov 15, 2026, target date Feb 5, 2027)
- Price at analysis: $26.86
- Price target: $24.50
- Expected range: $20.50 – $29.00
- Result: Pending — graded after the close on Feb 5, 2027
Get a free AI analysis of SMCI today
Analysis
TECHNICAL INDICATORS
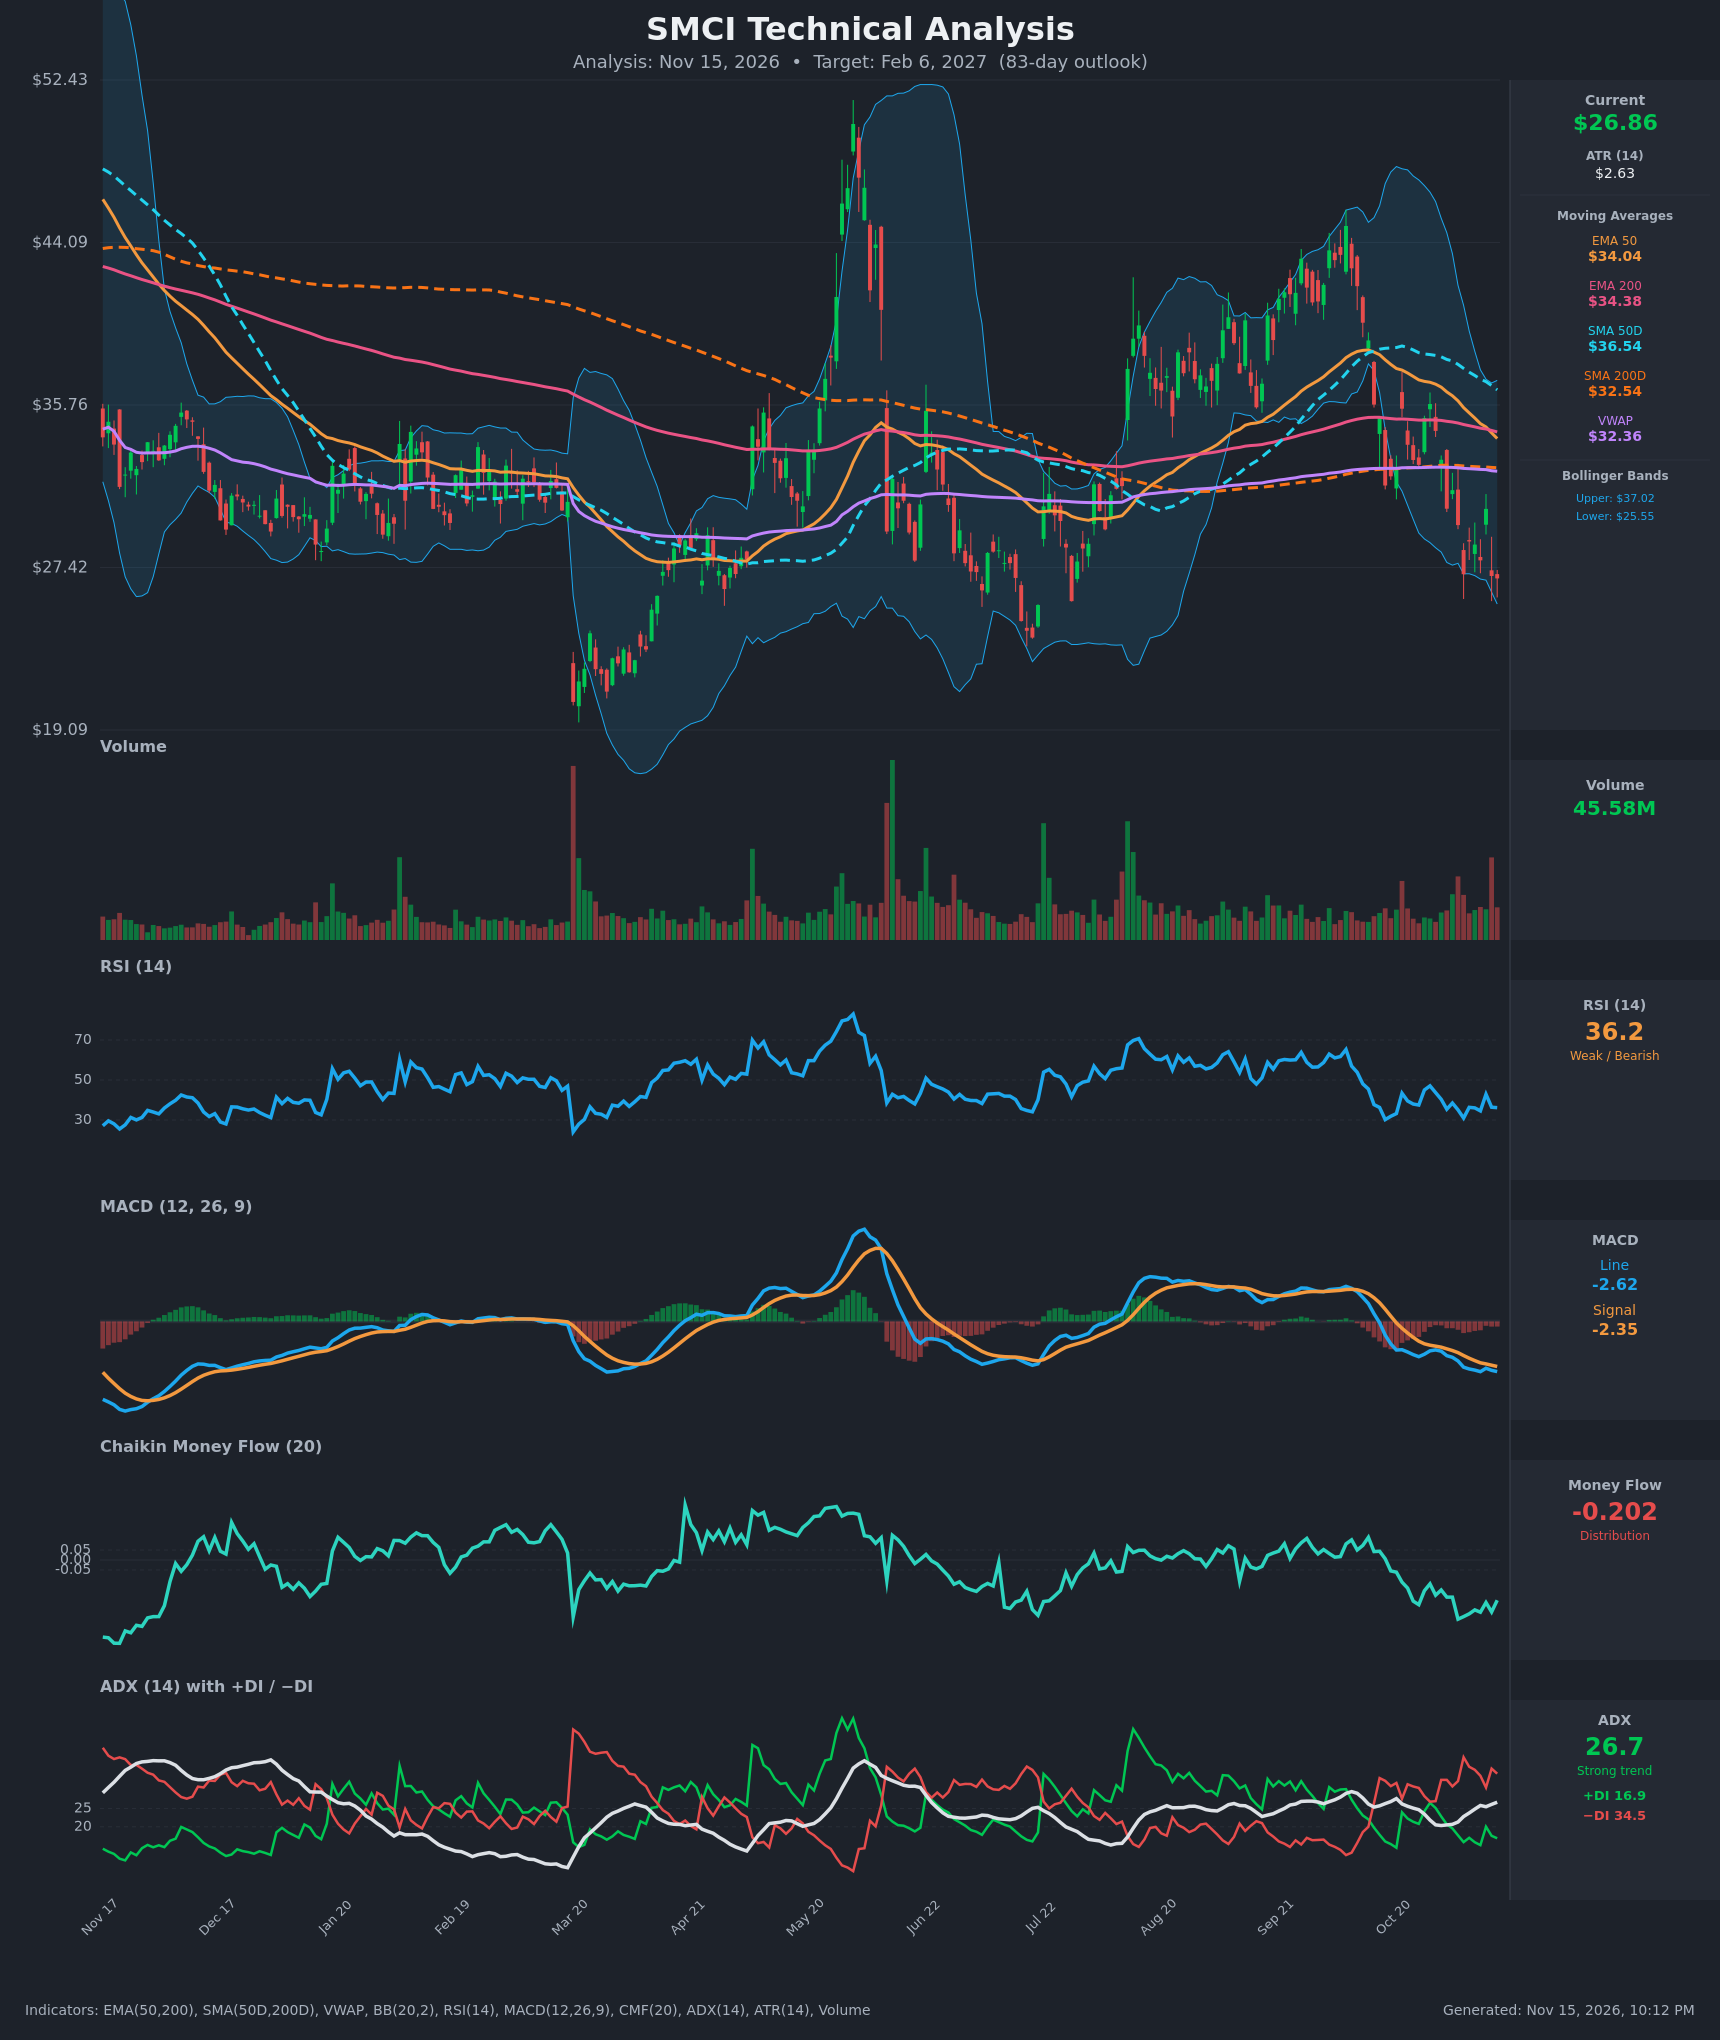
- RSI (14): 36.17, below 50 and approaching oversold but not there. It has been capped in the 30-45 range since late October, with a low of 31.0 on Nov 5. Momentum is weak with no bullish reversal yet. [Bearish]
- 20 EMA: The 20 EMA is not provided. The EMA 50 at $34.04 is well above price at $26.87, about 21% overhead, and has been falling steadily from $37.05. Short-term averages are acting as resistance. [Bearish]
- MACD: Line -2.617 is below signal -2.350, and the gap is widening (-2.552 vs -2.283 the day before). The histogram is negative and expanding. Both lines are well below zero. [Bearish]
- Bollinger Bands (20): Price at $26.87 is near the lower band ($25.55), about 17% of the band width above it. The upper band is at $37.02. The bands are expanding downward, consistent with trend continuation. A lower-band ride is possible, though an oversold bounce toward the midline (~$31.3) is likely at some point. [Bearish]
- CMF (20): -0.202, well below -0.05 and negative for the whole 15-bar window (range -0.12 to -0.30). This shows persistent distribution. [Distribution]
- ADX (14): 26.7 and rising from 20.3, so the trend is strengthening. -DI at 34.5 is far above +DI at 16.9, so bears are in firm control. [Strong Trend - Bearish]
- Volume: 45.58M, with heavier volume on red down bars in the recent selloff and a spike at the right edge of the chart. This is consistent with active distribution rather than capitulation so far. [Bearish]
DIVERGENCES & TRENDS
- No bullish RSI or MACD divergence. RSI made a higher low (35.4 → 31.0 → 36.2) only marginally, while price made lower lows. MACD is making new lows with price, which confirms the downtrend.
- The EMA 50 ($34.04) crossed below the EMA 200 ($34.38) on Nov 13 (it was $34.33 vs $34.45 on Nov 12). This is a bearish crossover. The SMA 50D ($36.54) is still above the SMA 200D ($32.54), so there is no death cross yet, but the gap is narrowing quickly (from $5.88 to $4.00 in 15 bars).
- Price is below the SMA 200D ($32.54), VWAP ($32.36), and both EMAs. The longer-term structure has broken down.
- MACD bearish crossover occurred in late October and has been widening since.
- The -DI/+DI spread is widening, and ADX is rising, a classic confirmation of a developing downtrend.
- The chart shows previous support at roughly $27-$28 (April lows) and a major low near $21-$22 (March and July).
CHART PATTERNS
- The price action since the September high near $46 is a lower-highs, lower-lows sequence, resembling a Bearish Head and Shoulders / lower-high reversal structure with the neckline breaking around $30-$31 (late October to early November).
- The broader structure also resembles a Bearish Rising Wedge / failed rally: the August-September advance was followed by a sharp breakdown. The measured move from the rally base points toward the $22-$26 area.
- Immediate support is the $25.5 lower band and then the $21-$23 zone (prior major lows). A close below $25.5 opens a path toward $22.
- Overhead resistance is dense: $30.4-$31.4 (recent breakdown area), then $32.4-$32.5 (VWAP/SMA 200D), then $34 (EMA 50/200).
POTENTIAL SCENARIOS
- Scenario 1: Bearish Trend Continuation — Downtrend persists, with -DI dominance, negative CMF and the EMA bearish cross driving price to retest the prior lows. Trigger: Daily close below $25.50 (lower Bollinger Band). Target: $22.00-$23.50. Invalidation: Daily close above $31.50. (50% probability)
- Scenario 2: Neutral Base and Range — Oversold conditions stabilize price between the $23 and $31 area, with choppy movement as the downtrend loses momentum. Trigger: Holding $24.5-$25.5 with RSI rising above 40. Target: $25.00-$29.00 range. Invalidation: Close below $24 or above $32. (25% probability)
- Scenario 3: Bullish Oversold Rebound — Mean reversion bounce toward the VWAP/SMA 200D cluster after capitulation volume. Trigger: Bullish MACD turn, CMF rising above -0.05, close above $30.50. Target: $32.00-$33.00. Invalidation: Close below $25. (25% probability)
PRICE TARGETS
For the 83-day timeframe (Feb 6, 2027), the range width should be ~18-30% of price, roughly $4.8-$8.1. SMCI is volatile (ATR $2.63, ~10% of price), so I use the wider end, about $8.2 or 30%.
- Target Price: $24.50 (about 8.8% below current)
- Expected Range: $20.50 to $29.00 (width $8.50 ≈ 31.6% of current price)
- Key Levels: Support at $25.55, Resistance at $30.45
OVERALL BIAS
OVERALL BIAS: BEARISH - Price is below all key moving averages, with a bearish EMA 50/200 cross, MACD widening below signal, -DI (34.5) far above +DI (16.9) with rising ADX, and persistent distribution (CMF -0.20). Oversold bounces are possible but the trend favors a retest of lower support.
This is educational analysis and not financial advice.