SMCI 62-day bearish forecast — Nov 15, 2026
- Bias: Bearish
- Timeframe: 62 days (made Nov 15, 2026, target date Jan 15, 2027)
- Price at analysis: $26.86
- Price target: $24.50
- Expected range: $20.00 – $32.00
- Result: Pending — graded after the close on Jan 15, 2027
Get a free AI analysis of SMCI today
Analysis
TECHNICAL INDICATORS
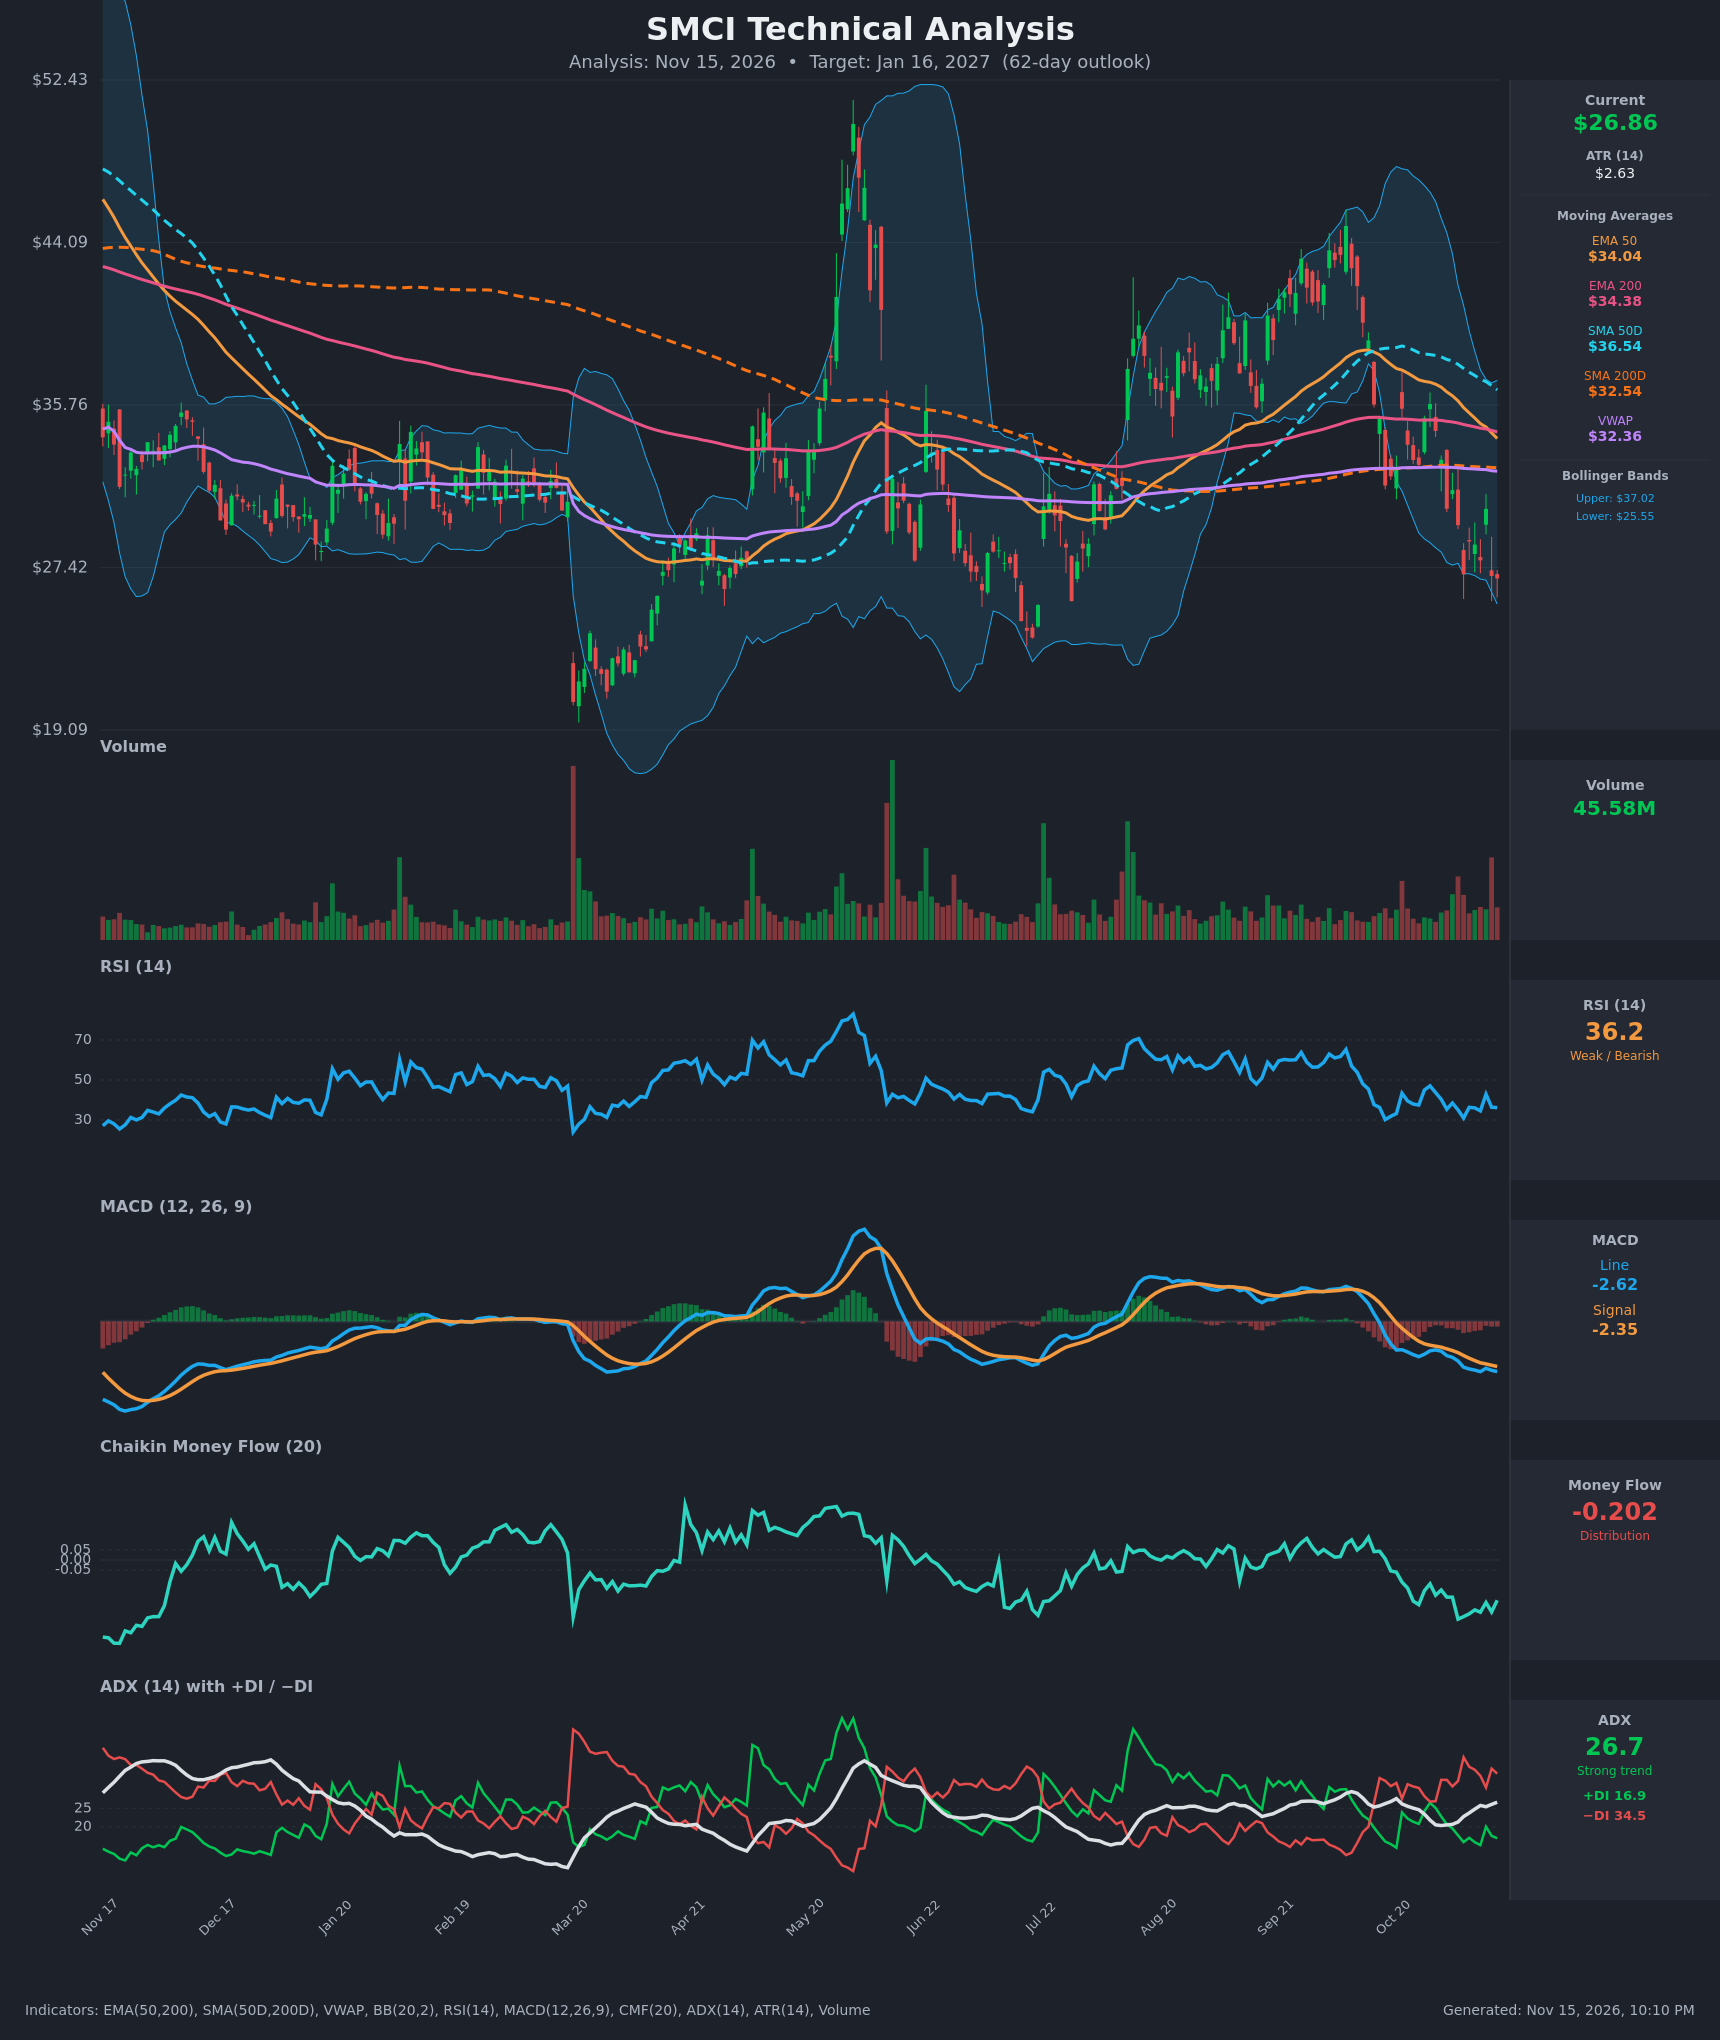
- RSI (14): 36.17, below 50 and near the oversold line at 30. It has been making lower highs since the Oct 27–28 bounce (47). It dipped to 31 on Nov 5 and has not recovered above 43. Momentum is weak but not yet washed out. [Bearish]
- 20 EMA: The 20 EMA isn't provided. Using the EMA 50 as proxy, it is $34.04 and falling, with price about 21% below it. Price also sits below the EMA 200 ($34.38), SMA 50D ($36.54), SMA 200D ($32.54) and VWAP ($32.36). All of these act as overhead resistance. [Bearish]
- MACD: Line -2.617 is below signal -2.350, and both are below zero. The line has stayed under the signal since Oct 26, and the gap has widened from -0.03 to -0.27. The histogram is negative and slowly expanding. [Bearish]
- Bollinger Bands (20): Price at $26.87 is near the lower band ($25.55). The upper band is $37.02, so the bands are wide and volatility is elevated. Price has been walking the lower half of the bands. A touch of the lower band could trigger a short-term bounce, but in a downtrend it often means continued band-walking. [Bearish]
- CMF (20): -0.202, well below -0.05, and it has trended from positive in Sep/early Oct to deeply negative. This shows sustained distribution with no sign of reversal. [Distribution]
- ADX (14): 26.7 and rising from 20.3 (Oct 30). −DI at 34.5 is far above +DI at 16.9, and −DI has been on top since Oct 30. This is a strong, bearish-directed trend. [Strong Trend – Bearish]
- Volume: 45.58M, with a recent spike on a red candle, as the chart's last bars show. Heavier volume on down days suggests selling pressure. There is no capitulation spike like the one seen in March, so a washout bottom is not confirmed. [Bearish – distribution]
DIVERGENCES & TRENDS
- No bullish divergence has formed. RSI made a slightly higher low (36 vs 31) while price is at a similar level (~$27), but MACD and CMF keep making lower lows. That is not a confirmed divergence.
- Death cross dynamics: EMA 50 ($34.04) has crossed below EMA 200 ($34.38) on Nov 12–13. The SMA 50D ($36.54) is still above the SMA 200D ($32.54), but the gap is narrowing quickly (from ~$5.9 to ~$4.0 in 15 bars). A death cross on the daily SMAs is plausible within the forecast window if weakness persists.
- Price fell from ~$46 (Sep/Oct peak) to $26.87, losing about 40%. Lower highs and lower lows are in place since the early-October top.
- Price is just below the $27–28 area, which acted as a base in Mar/Apr and Jul.
- The Nov 11 bounce to $30.43 was fully reversed in two sessions, showing weak demand at higher prices.
- ADX is rising while −DI dominates, so the trend is strengthening rather than exhausting.
CHART PATTERNS
- The decline from the Oct high resembles a Bearish Flag/Pennant continuation. It shows a sharp drop, a brief consolidation around $30–35, then a breakdown. Measured-move logic points toward the low-$20s.
- The $27–28 zone is a multi-test support area (Apr, Jul, Nov), similar to a Triple Bottom / Bullish Double Bottom from the reference. Price has not yet confirmed a reversal, and a break below ~$26 would invalidate that bullish structure.
- The 2026 range after the March spike low (~$21) shows $21 as the major support floor if $26–27 gives way.
- Targets: breakdown toward $21–23 (the March low area / ATR-based extension); a relief bounce toward the $32 VWAP/SMA 200D zone if support holds.
POTENTIAL SCENARIOS
- Scenario 1: Bearish Trend Continuation — −DI dominance, negative MACD and CMF, and price below every moving average favor further downside, with a test of the late-spring/March lows. Trigger: daily close below $25.50 (lower Bollinger Band) and below the Nov 5 low (~$26). Target: $22.00–$23.50. Invalidation: daily close above $32.40 (VWAP/SMA 200D). (50% probability)
- Scenario 2: Neutral Base Building — Price holds the $24–29 zone for weeks, with RSI stabilizing and the volatility squeeze easing, as in prior bases around Mar–Apr and Jul. Trigger: repeated defenses of $25–26 on lower volume. Target: $25–$29 range. Invalidation: close below $24 or above $31. (20% probability)
- Scenario 3: Bullish Oversold Rebound — A bounce from the lower band back to the mean-reversion zone, with the $32–34 cluster (VWAP, SMA 200D, EMAs) as the target. Trigger: RSI above 45 with a MACD bullish cross and CMF turning above 0. Target: $31.00–$33.50. Invalidation: close below $25.00. (30% probability)
PRICE TARGETS
- Target Price: $24.50 (62 days, Jan 16, 2027)
- Expected Range: $20.00 to $32.00 (width $12.00 ≈ 44.7% of current price). This is wider than the 18–30% guidance because SMCI's ATR is ~9.8% of price and its range history is violent, so a 62-day outcome naturally spans a large range. The self-check passes, since the width is much greater than a 14-day range would be.
- Key Levels: Support at $25.55 (lower Bollinger Band; then $21–22 March low area), Resistance at $30.44 (Nov 11 high close; then $32.36 VWAP / $32.54 SMA 200D)
OVERALL BIAS
OVERALL BIAS: BEARISH - Price is below every major moving average. The MACD is negative and widening, CMF shows heavy distribution (-0.20), and ADX at 26.7 with −DI (34.5) far above +DI (16.9) confirms a strong downtrend. A rebound from the oversold lower band is possible, but evidence favors a further drift lower toward the low-$20s.
This is educational analysis and not financial advice.