SMCI 48-day bearish forecast — Nov 15, 2026
- Bias: Bearish
- Timeframe: 48 days (made Nov 15, 2026, target date Jan 1, 2027)
- Price at analysis: $26.86
- Price target: $25.20
- Expected range: $22.90 – $27.30
- Result: Pending — graded after the close on Jan 1, 2027
Get a free AI analysis of SMCI today
Analysis
TECHNICAL INDICATORS
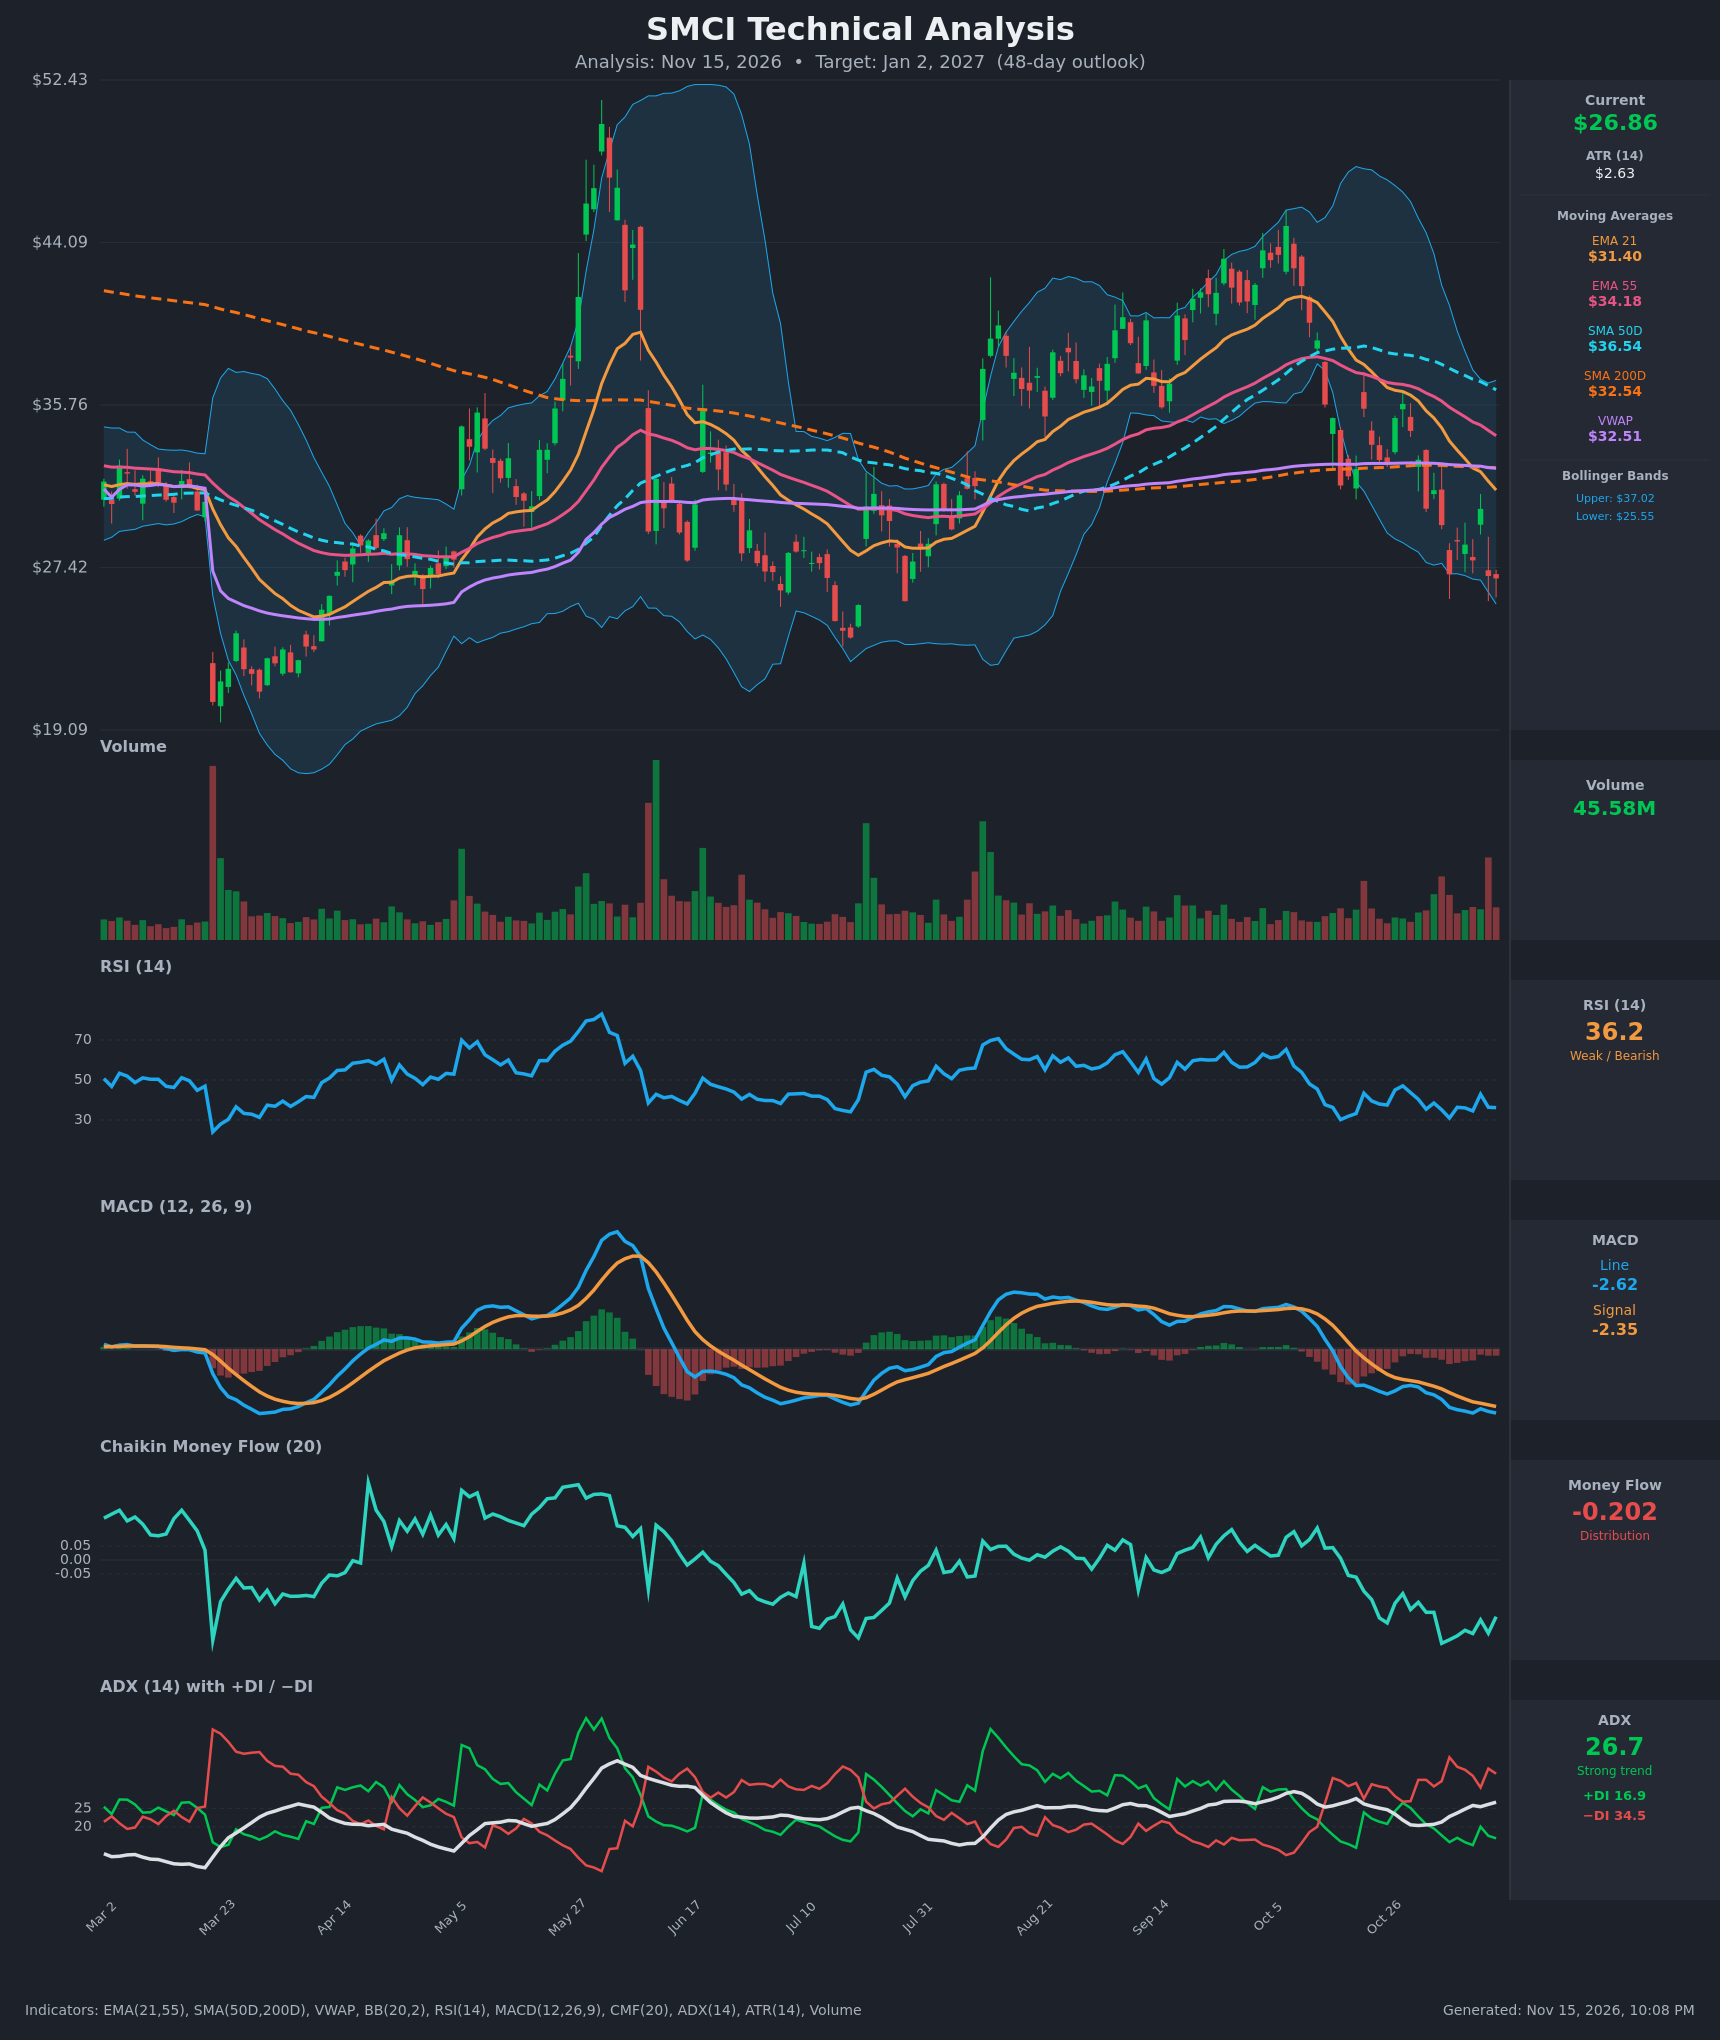
- RSI (14): 36.17, in the weak zone but not yet oversold (<30). It has made a series of lower highs since the Oct 28 reading of 47. The Nov 5 low was 31.0, and the current reading is slightly higher even though price is marginally lower at $26.86 versus $27.08. That is a mild, unconfirmed bullish divergence. [Bearish]
- 20 EMA: The chart uses EMA 21 at $31.40, and price at $26.87 is about 14% below it. The EMA is falling steeply (from $36.66 on Oct 26), so it acts as dynamic resistance. EMA 21 is also below EMA 55 ($34.18), a bearish crossover that occurred around Oct 26. [Bearish]
- MACD: Line -2.617 is below signal -2.350, and both are negative and falling. The histogram is negative and widening, and the line is making new lows without a bullish crossover. [Bearish]
- Bollinger Bands (20): Price is $26.87 against a lower band of $25.55, an upper band of $37.02 and a midline of about $31.3. It is hugging the lower half of the bands and walking the lower band. The bands have been expanding since the October drop, which points to a persistent downtrend rather than a squeeze. [Bearish]
- CMF (20): -0.202, well below -0.05 and near the lowest levels on the chart. Selling pressure has been sustained since early October, and there is no recovery toward zero. [Distribution]
- ADX (14): 26.7 and rising (from 20.3 on Oct 30). −DI at 34.5 is far above +DI at 16.9, and the DI spread has widened. This is a strong, strengthening downtrend. [Strong Trend – Bearish]
- Volume: 45.58M, above the recent baseline, with the largest bars recently on red down days (e.g., the tall red bar in early November). Selling carries conviction, and the small rebound days have not drawn matching volume. [Bearish – distribution on declines]
DIVERGENCES & TRENDS
- Trend: Price has fallen from about $44 in early October to $26.86, with lower highs ($35.81, then $31.39, then $30.43) and lower lows. It sits below EMA 21, EMA 55, SMA 50D ($36.54), VWAP ($32.51) and SMA 200D ($32.54), a fully bearish alignment.
- Moving-average crossovers: EMA 21 crossed below EMA 55 in late October. SMA 50D ($36.54) is still above SMA 200D ($32.54), but the gap is narrowing quickly, so a death cross is plausible within the 48-day window.
- MACD: No bullish crossover. The MACD line is still falling and the histogram is expanding negatively.
- RSI divergence: Mild bullish divergence versus the Nov 5 low (RSI 31.0 against 36.2 now). It is not confirmed by MACD or CMF, which both make new lows.
- DI/ADX: −DI has been above +DI since Oct 30 and ADX is rising. This is trend confirmation, not exhaustion.
- Support test: Price is pressing the lower Bollinger Band, which raises the odds of a short-term relief bounce. Bounces in strong downtrends usually stall near the EMA 21 or the $30–31 area.
CHART PATTERNS
- Bearish continuation structure (Bearish Flag/Pennant-like): The brief rebound on Oct 27–28 and the Nov 11 spike to $30.43 were followed by sharp declines. These look like failed lower-high bounces within a descending channel. The measured move of the prior leg lower points to the low-to-mid $20s.
- Head-and-Shoulders-style top: The $44 area in early October, followed by a break of the neckline around $33–35 (the support at the SMA 200D/VWAP cluster), fits a bearish reversal. The implied target from that break is roughly the $25–27 zone, which has largely been reached.
- Potential Falling Wedge / Double Bottom (Bullish, low confidence): Price is stalling near $27 (Nov 5 low $27.08, Nov 10 close $27.79, now $26.86). A bullish reversal would need a break above about $30.4 with improving CMF. This is not confirmed.
- Key structure: Prior consolidation lows from July–August sit around $24.5–25.5, the next logical support.
POTENTIAL SCENARIOS
- Scenario 1: Bearish Trend Continuation — The downtrend persists with −DI dominant, CMF in distribution and price below all key moving averages. Relief bounces fail near EMA 21/$30. Trigger: daily close below $25.55 (lower Bollinger Band) and below $25.00. Target: $23.00–$25.00, with a possible extension toward $22 if the SMA death cross develops. Invalidation: daily close above $30.45 (the Nov 11 swing high) with RSI above 50. (55% probability)
- Scenario 2: Bullish Oversold Relief Bounce — The mild RSI divergence and the lower-band test produce a rebound toward the declining EMA 21, where sellers are likely to re-engage. Trigger: close above $28.80 on rising volume with a CMF uptick. Target: $30.40–$31.40 (recent swing high and EMA 21). Invalidation: close below $25.00. (30% probability)
- Scenario 3: Neutral Basing Range — Price chops between roughly $25 and $29.5 as selling exhausts. Trigger: ADX rolling over below 25 and repeated defenses of $25.5. Target: $26–$28. Invalidation: break outside $25.00–$29.50. (15% probability)
PRICE TARGETS
- Target Price: $25.20 (48-day, about 6.2% below current)
- Expected Range: $22.90 to $27.30 (width $4.40, about 16.4% of current price, in line with 30–60 day guidance of 12–18%)
- Key Levels: Support at $24.50, Resistance at $30.40
OVERALL BIAS
OVERALL BIAS: BEARISH - Price is below all major moving averages with a bearish EMA cross, a widening negative MACD, CMF at -0.20 (distribution) and a strong, rising ADX with −DI far above +DI. The mild RSI divergence suggests a possible bounce, but the weight of evidence favors lower prices toward $25.
This is educational analysis and not financial advice.