SMCI 27-day bearish forecast — Nov 15, 2026
- Bias: Bearish
- Timeframe: 27 days (made Nov 15, 2026, target date Dec 11, 2026)
- Price at analysis: $26.86
- Price target: $24.80
- Expected range: $21.80 – $29.30
- Result: Pending — graded after the close on Dec 11, 2026
Get a free AI analysis of SMCI today
Analysis
TECHNICAL INDICATORS
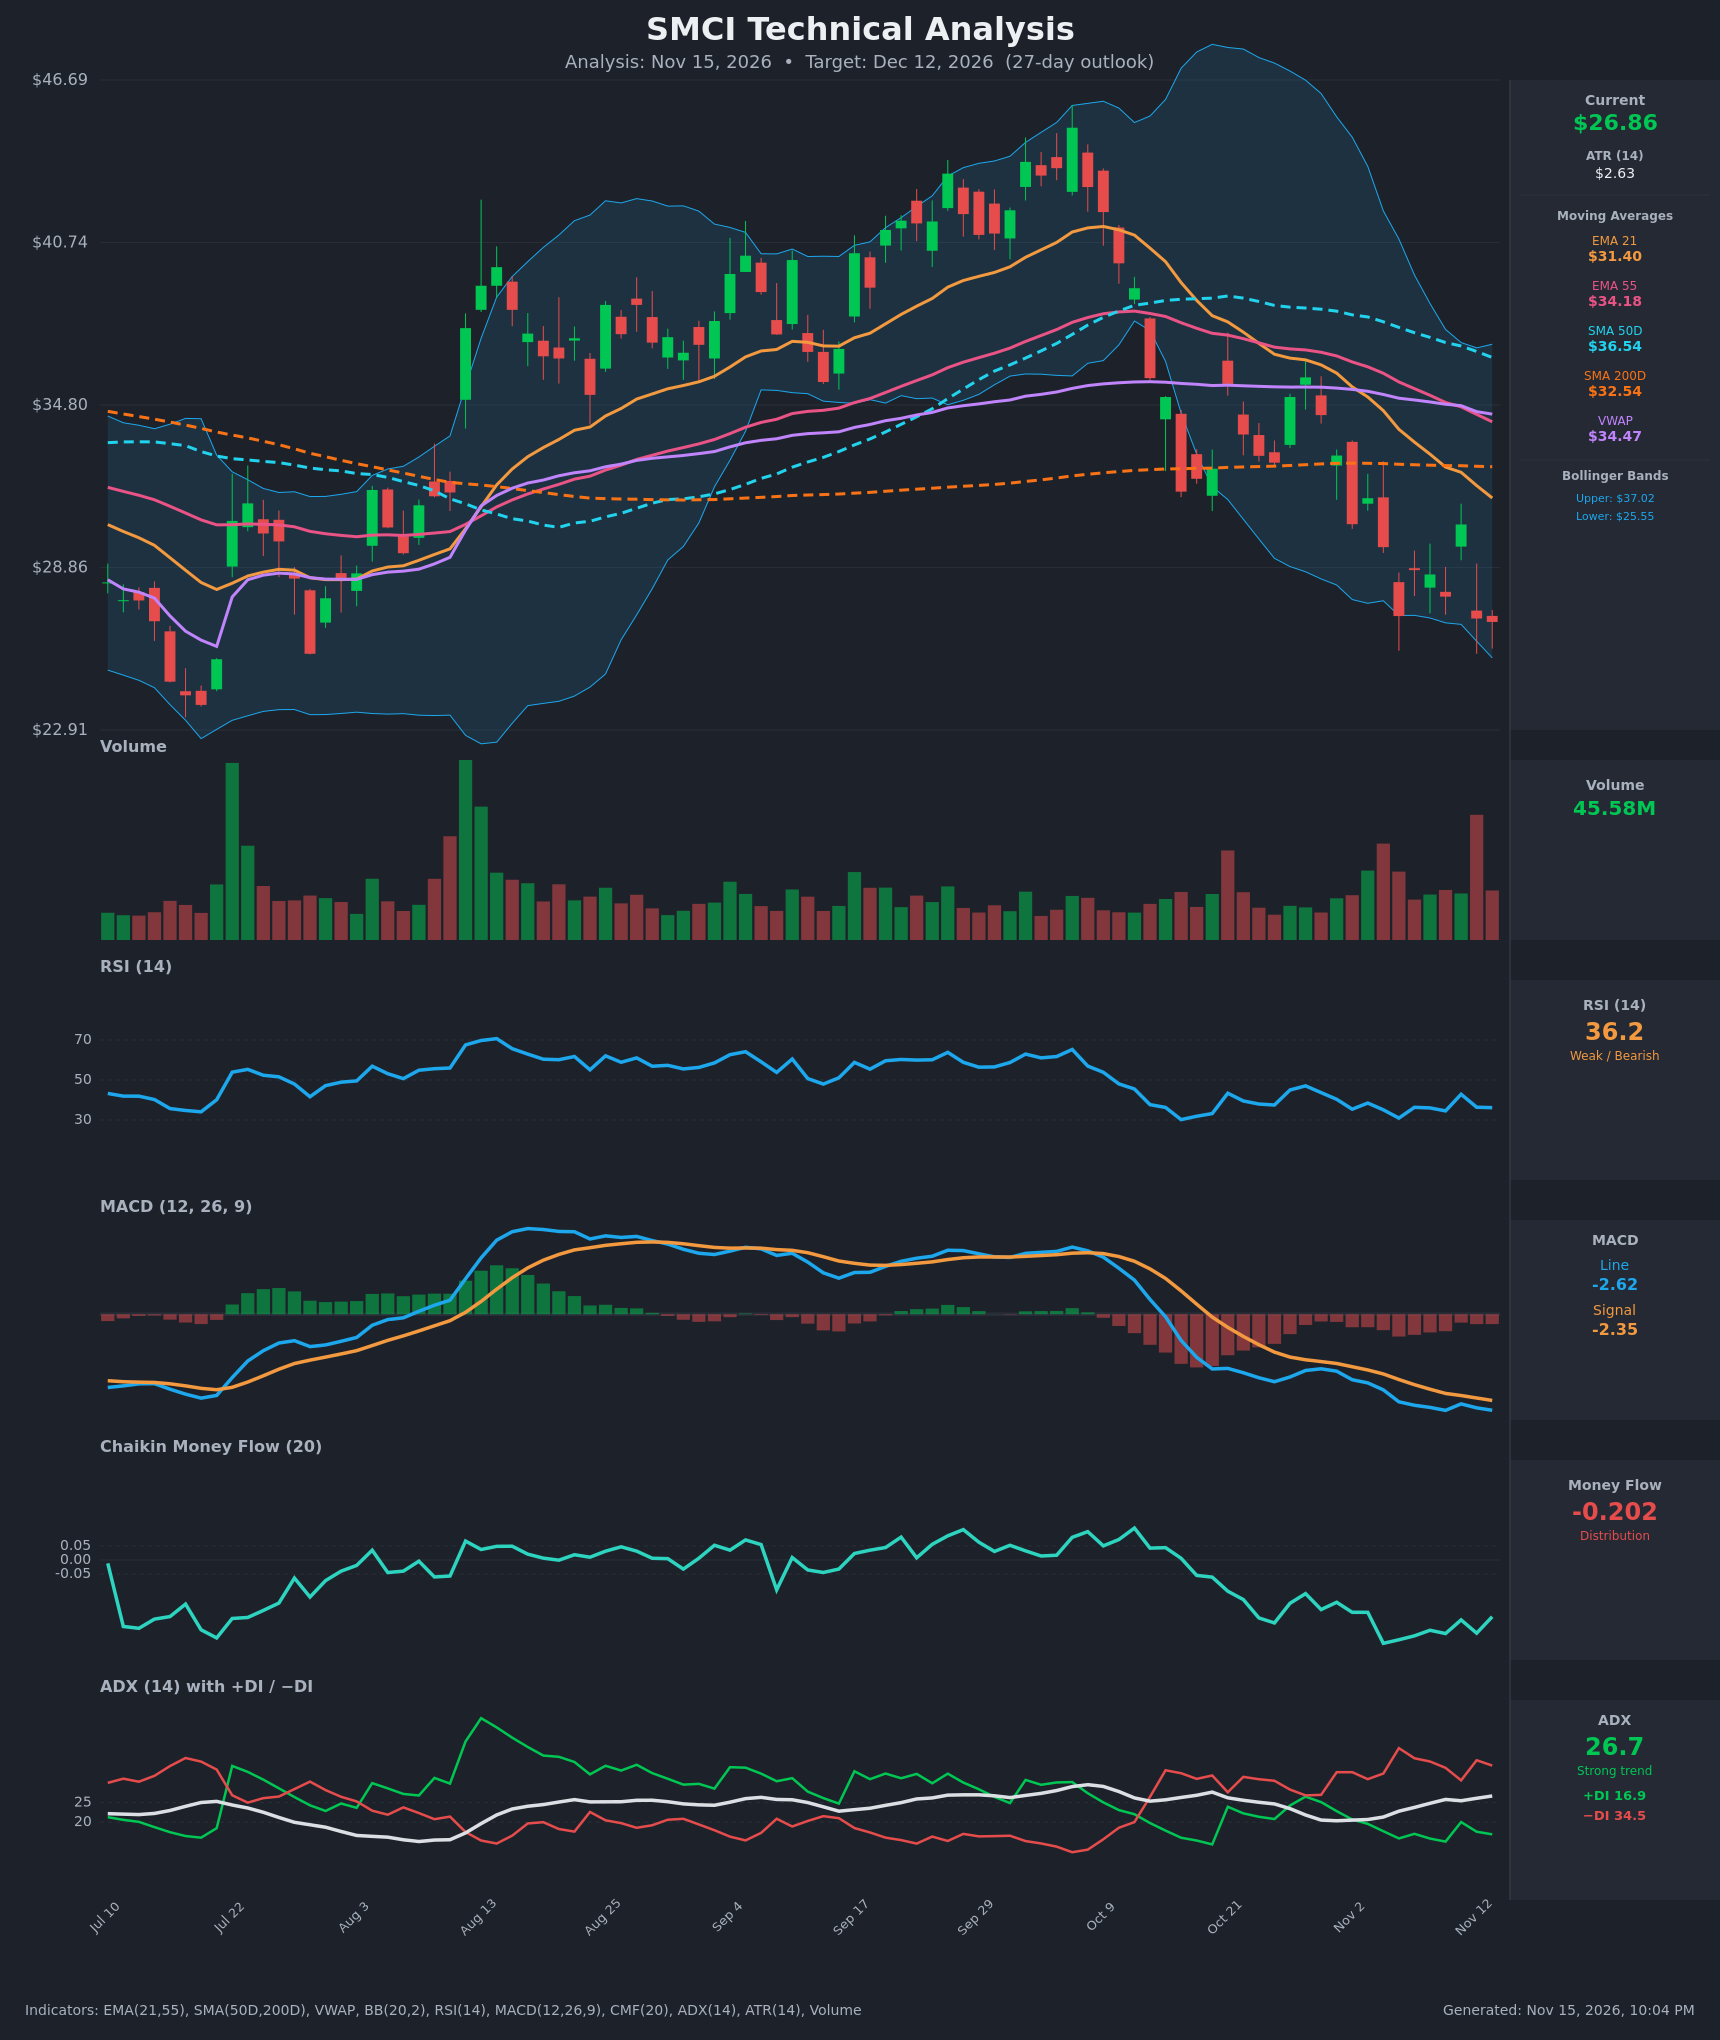
- RSI (14): 36.17, below 50 and approaching oversold but not there. It has been capped in the 30-45 zone since mid-October, with lower highs. Momentum is weak with no bullish divergence yet. [Bearish]
- 20 EMA (EMA 21): $31.40, with price at $26.87 about 14% below it. EMA 21 is falling steeply and sits below EMA 55 ($34.18), so it acts as overhead resistance. [Bearish]
- MACD: Line -2.62 is below signal -2.35, and both are below zero. The line has been below the signal since early November and the histogram is negative, with no sign of a bullish cross. [Bearish]
- Bollinger Bands (20): Upper $37.02, lower $25.55. Price at $26.87 is in the lower quarter of the band, near the lower band, after a "walk" down the band. The bands are still wide after the earlier expansion, so a stretched but not extreme reading could produce a bounce, but downtrends can hug the lower band. [Bearish]
- CMF (20): -0.202, well below -0.05 and near the cycle lows, so selling pressure is persistent. [Distribution]
- ADX (14): 26.7 and rising, above the 25 threshold. −DI at 34.5 is far above +DI at 16.9, so bears control a strong downtrend. [Strong Trend – Bearish]
- Volume: 45.58M on the latest bar, with heavy red-volume spikes in early November (including the largest recent bar). Selling has come on elevated volume with no capitulation reversal bar yet. [Bearish – distribution on down days]
DIVERGENCES & TRENDS
- No bullish RSI or MACD divergence is confirmed. RSI at 36 is above its early-Nov low of 31 while price is at or near new lows ($26.86 vs $27.08), a faint hint of divergence, but it is not confirmed and MACD is still making lower lows.
- Moving averages are in a bearish cascade: price < EMA21 < EMA55 < SMA50D, and VWAP ($34.47) sits far above price.
- The 50D SMA ($36.54) is above the 200D SMA ($32.54), so there is no death cross yet. The 50D is rolling over and the gap is narrowing, and a death cross is possible within weeks.
- Price is below the 200D SMA at $32.54, which confirms a break of long-term support, now resistance.
- The −DI/+DI gap has widened since late October and ADX is turning up, which signals a strengthening downtrend.
- A failed bounce on Nov 11 (close $30.43) was rejected the next day (close $26.99), which confirms sellers at lower highs.
CHART PATTERNS
- Bearish Head and Shoulders / Double Top (reversal): The September-October highs near $44-45 followed by the sharp collapse resemble a completed topping structure. The break below the ~$32-33 neckline area (SMA200D) fits the bearish reversal target path.
- Bearish continuation / descending channel: Lower highs ($35.8, $31.4, $30.4) and lower lows now form a downward staircase similar to a bearish flag/descending structure.
- Price is sitting at a prior support zone of roughly $23-25 (July lows) and near the lower Bollinger Band, which is the main hold-or-break area. A break below ~$25.5 would extend the measured-move target toward the low-$20s.
POTENTIAL SCENARIOS
- Scenario 1: Bearish Continuation Lower — The strong ADX trend, −DI dominance, distribution and bearish MACD keep price pressing the lower band and break $25.50. Trigger: daily close below $25.50 on volume. Target: $22.50-$23.50 (July low zone). Invalidation: daily close above $30.50. (50% probability)
- Scenario 2: Neutral/Bullish Oversold Bounce Then Fade — Price holds the $24-26 support, RSI near 30 prompts a relief rally toward the falling EMA21 and stalls there. Trigger: hold of $25 with a green volume-backed bar above $28.50. Target: $30.00-$31.50. Invalidation: close below $25.00. (35% probability)
- Scenario 3: Bullish Reversal — A capitulation low and a bullish divergence trigger a bigger recovery toward the 200D SMA. Trigger: close above $31.50 (EMA21) with CMF turning positive. Target: $32.50-$34.00. Invalidation: rejection at $31.50 and a lower low. (15% probability)
PRICE TARGETS
For 27 days, the range width should be ~12-18% of price, and ATR of $2.63 supports a wide spread. The bearish bias is modest because of the oversold conditions near support.
- Target Price: $24.80 (27-day)
- Expected Range: $21.80 to $29.30 (width $7.50 = ~27.9%; widened modestly beyond the 12-18% guide because of high volatility, with ATR ~10% of price)
- Key Levels: Support at $25.50, Resistance at $31.40
OVERALL BIAS
OVERALL BIAS: BEARISH - Price is below every major moving average with MACD negative, CMF at -0.20, ADX of 26.7 rising and −DI (34.5) dominating +DI (16.9). Oversold conditions near $25 support could trigger bounces, but the trend favors lower prices over the next 27 days.
This is educational analysis and not financial advice.