SMCI 20-day bearish forecast — Nov 15, 2026
- Bias: Bearish
- Timeframe: 20 days (made Nov 15, 2026, target date Dec 4, 2026)
- Price at analysis: $26.86
- Price target: $25.40
- Expected range: $22.00 – $29.00
- Result: Pending — graded after the close on Dec 4, 2026
Get a free AI analysis of SMCI today
Analysis
TECHNICAL INDICATORS
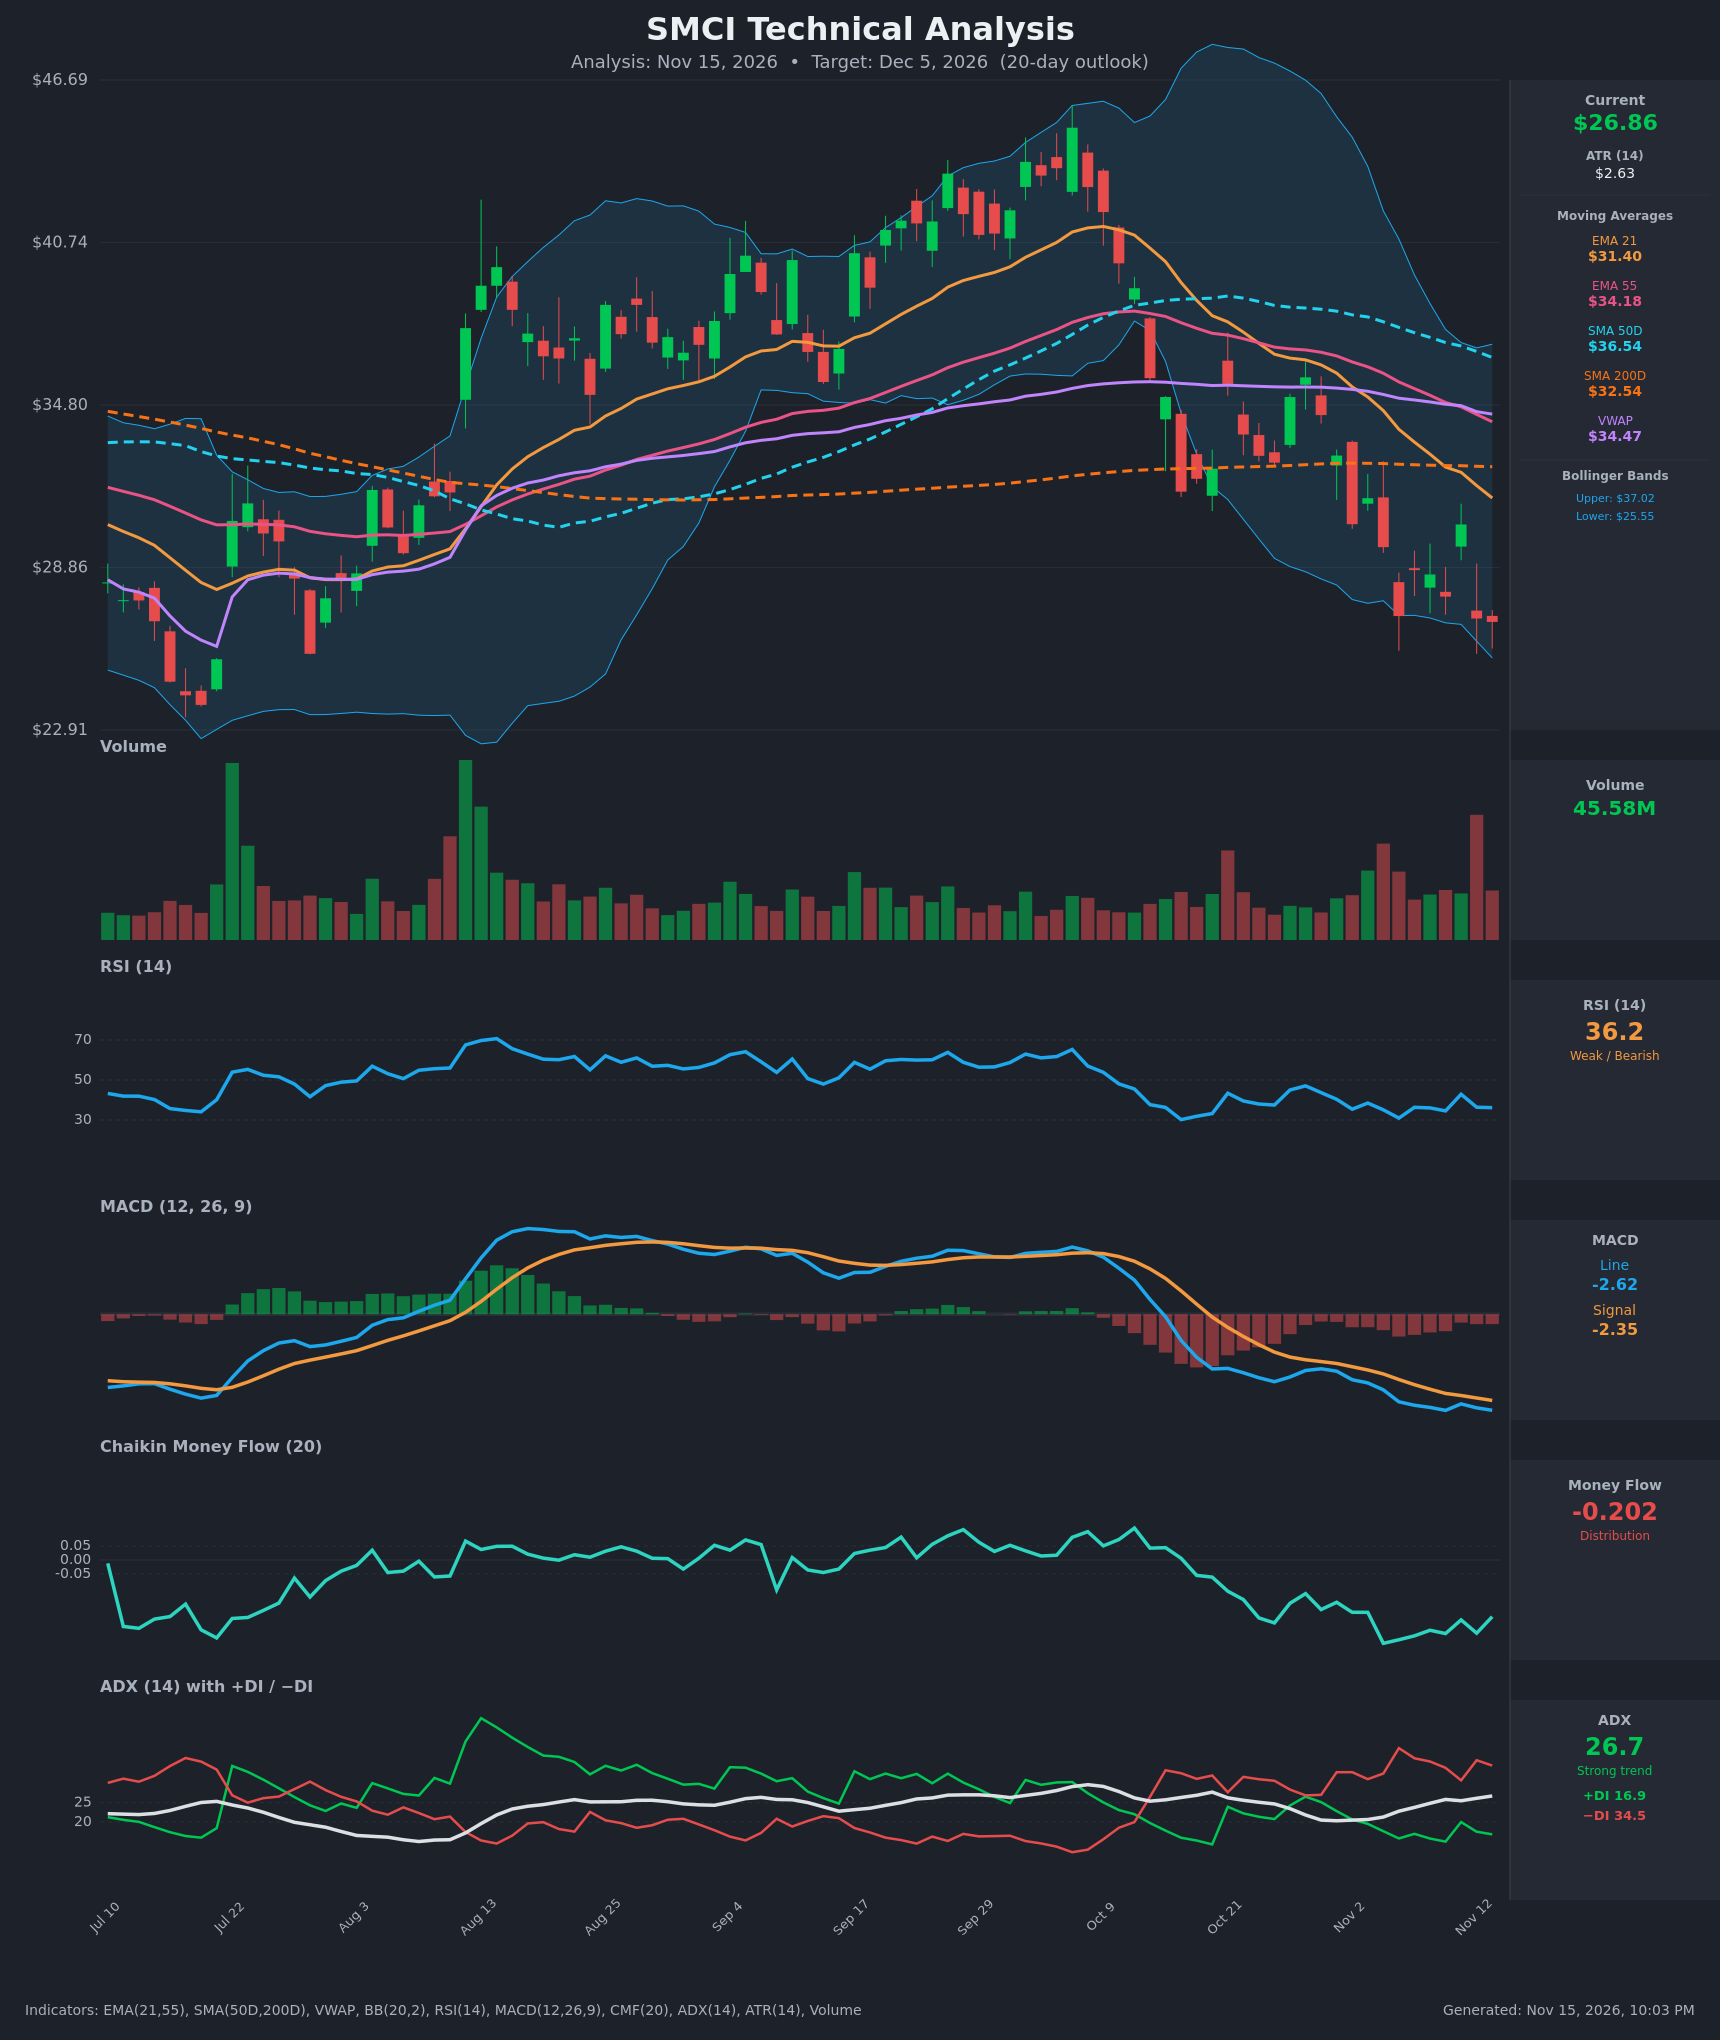
- RSI (14): 36.17, below 50 and close to oversold (30). It has stayed in a 31–43 band for about three weeks, with no bullish momentum thrust. It has not reached oversold, so selling pressure is persistent but not yet extreme. [Bearish]
- 20 EMA: The EMA 21 is $31.40, about 17% above the $26.87 price, and it is falling steeply (from $36.66 on Oct 26). It is overhead resistance, and the EMA 21 sits below the EMA 55 ($34.18), a bearish alignment. [Bearish]
- MACD: Line -2.62 is below Signal -2.35, and the histogram is negative at about -0.27. The line has been below the signal since the late-October bearish crossover. Both lines are making new lows, so downside momentum is still expanding. [Bearish]
- Bollinger Bands (20): Upper $37.02, lower $25.55. Price at $26.87 is in the lower quarter of the band, about $1.3 above the lower band. The bands are wide after the earlier volatility, but they are now narrowing and sloping down. Price is walking the lower half of the band, which is trend-following bearish rather than a clean mean-reversion setup. [Bearish]
- CMF (20): -0.202, well below -0.05, and it has been negative since mid-October. That is sustained distribution with no sign of accumulation. [Distribution]
- ADX (14): 26.7 and rising, with -DI (34.5) far above +DI (16.9). The trend is strong and firmly controlled by sellers. [Strong Trend – Bearish]
- Volume: 45.58M on the latest bar. Recent heavy-volume spikes have come on red candles, especially the large one near the Nov 12 low, while bounces have come on lighter volume. This points to heavy selling or capitulation-style distribution. [Bearish – selling volume dominant]
DIVERGENCES & TRENDS
- No bullish divergence yet: Price made a lower low (the $26.86 close is below the $27.08 low on Nov 5), and RSI (36.2 vs 31.0) and MACD (-2.62 vs -2.39) are mixed. RSI is slightly higher, which is a very mild divergence. MACD confirms the lower low, and CMF is only modestly off its low, so reversal evidence is weak.
- Moving average structure: Price is below the EMA 21, EMA 55, SMA 50D ($36.54), VWAP ($34.47) and the SMA 200D ($32.54). The EMA 21 is below the EMA 55, and the SMA 50D is above the SMA 200D but rolling over and curling down. The 50D/200D gap has been narrowing, so a death cross is a possible risk in coming weeks.
- Bounce failures: The Nov 11 bounce to $30.43 (RSI 42.9) fully reversed the next day to $26.99. Rallies are being sold into, which is characteristic of a strong downtrend.
- DI/ADX: -DI has led +DI since Oct 30, and ADX has risen from 20 to 26.7, confirming a strengthening downtrend.
CHART PATTERNS
- Primary pattern: The decline from the ~$45 October high to ~$27 follows a Bearish Rising Wedge / Double Top style reversal in the reference diagram. The Sep–Oct highs near $43–45 failed, and price broke down through the EMAs, the SMA 50D and then the SMA 200D.
- Current structure: The last several weeks show lower highs ($35.8 → $32.9 → $30.4) and lower lows, a descending channel. It looks like a bearish continuation after the breakdown, similar to a Bearish Flag/Descending Triangle with horizontal support near $25–27 being tested.
- Targets: The measured move of the double-top-style break from the ~$45 peak toward the ~$32 neckline suggests roughly 13 points of downside, which has largely played out. A break below the $25.5–26 support zone would target the July–August lows of roughly $23–24 (the chart's $22.91 axis floor).
- Bullish alternative: A Bullish Falling Wedge could form if price stabilizes with shrinking ranges and RSI divergence, but this is not yet confirmed.
POTENTIAL SCENARIOS
- Scenario 1: Bearish Continuation to the Prior Lows — Sellers keep control (-DI 34.5, ADX rising, CMF -0.20). Price loses the lower Bollinger Band near $25.55 and drifts toward the July–August lows. Trigger: daily close below $25.50 on high volume. Target: $23.00–$24.00. Invalidation: close above the EMA 21 near $31.40. (50% probability)
- Scenario 2: Neutral/Bearish Base and Relief Bounce — Price is oversold-ish at the lower band, so a bounce toward the declining EMA 21 is likely at some point, but it stalls beneath resistance. Trigger: hold of $25.50 and RSI turning up above 40. Target: $28.50–$30.50, then rejection. Invalidation: close below $25.00. (32% probability)
- Scenario 3: Bullish Reversal — Capitulation volume marks a low and price reclaims the EMA 21 and VWAP. Trigger: close above $31.50 with MACD crossing up. Target: $33–$34.50 (EMA 55/VWAP). Invalidation: failure to hold $28. (18% probability)
PRICE TARGETS
For the 20-day horizon (to Dec 5, 2026), the guidance is a range width of ~8–12% for 14–21 days. A volatility-driven range is wider given ATR of $2.63 (~9.8% of price), so I use ~$7.00 of width (~26%), which is above the guide because this is a highly volatile stock. Self-check: the 20-day range ($7.00, ~26%) is wider than a 2-3 day range, so it is consistent with the timeframe scaling and reflects the current ATR.
- Target Price: $25.40 (about 5.5% below current price)
- Expected Range: $22.00 to $29.00 (width $7.00, ~26% of current price)
- Key Levels: Support at $25.55 (lower Bollinger Band), Resistance at $31.40 (EMA 21; nearer minor resistance around $30.40 from the Nov 11 close)
OVERALL BIAS
OVERALL BIAS: BEARISH - Price is below every moving average, MACD is below its signal and still falling, CMF shows heavy distribution (-0.20), and ADX 26.7 with -DI at 34.5 vs +DI at 16.9 confirms a strong downtrend. Relief bounces are likely but should meet resistance well below the EMA 21.
This is educational analysis and not financial advice.